
New — Model Books, Ask SetupsGalore & CommunityNOW LIVE

Analyze the patterns.
Activate your edge.

The visual trade research platform for serious traders. Journal your chart setups, measure your edge with analytics, generate research-grade Model Books, ask SetupsGalore about your trades, and share playbooks with a community of traders.

See how it works
— trades indexed— collections
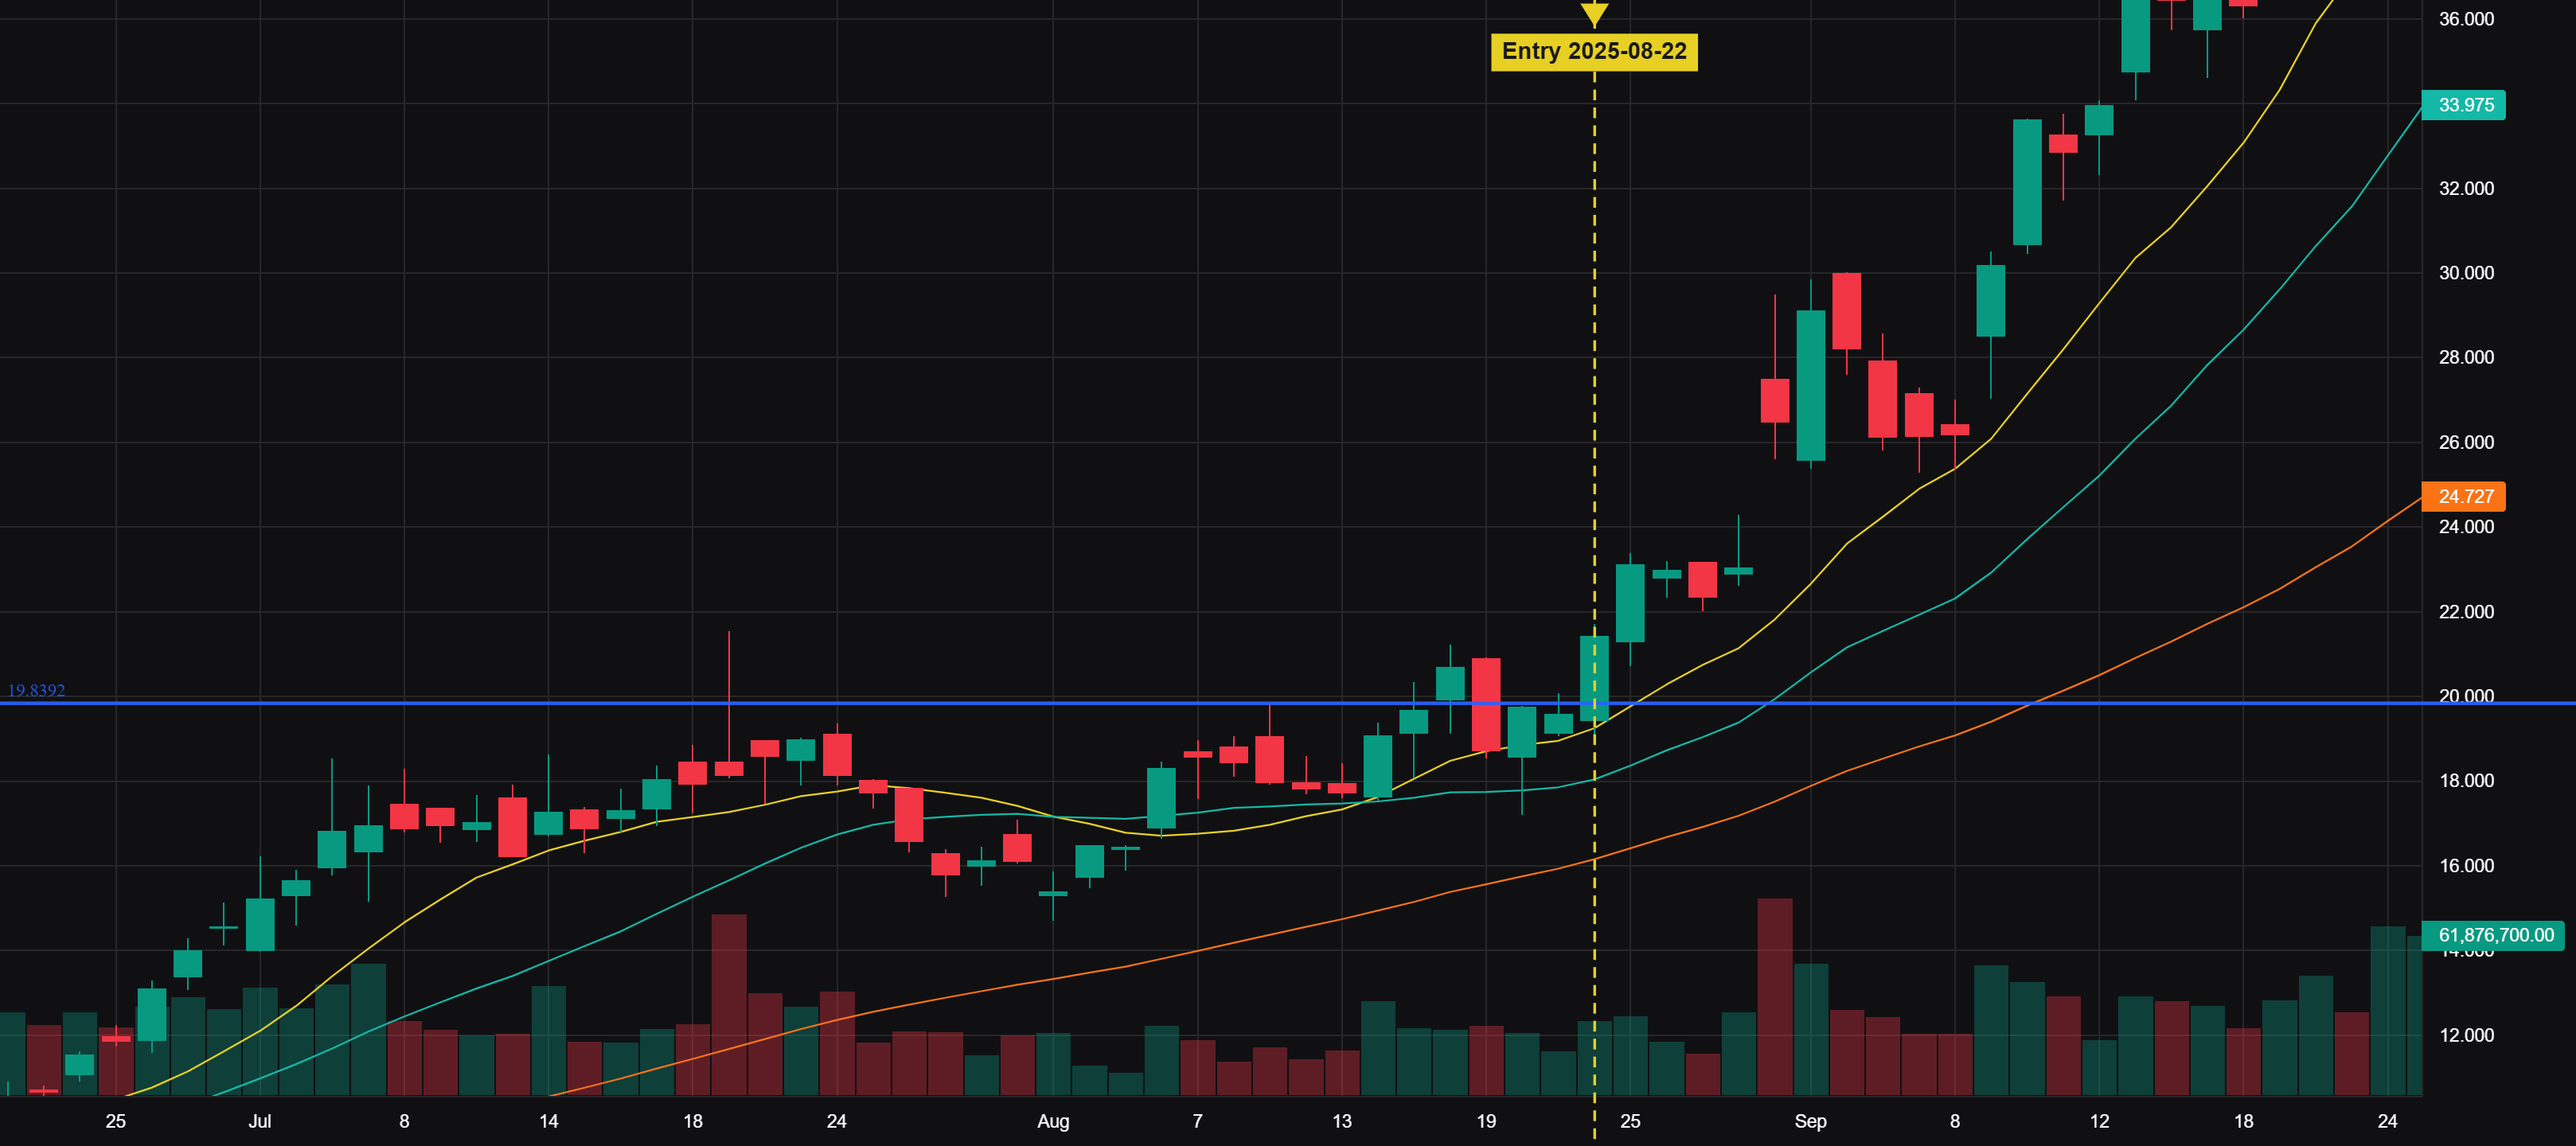
IRENLONG · FLAG BREAKOUT
1D · entry 19.84 · last 33.98 +71.3%
★★★★★   entry 08/22
IREN daily chart — flag breakout with entry marked 2025-08-22

Powered by industry-leading data & infrastructure

  • TradingView
  • Alpha Vantage
  • Stripe
  • Supabase
  • Vercel
  • Next.js

Everything you need to
study your trading.

From raw chart screenshots to a quantified edge — every surface of SetupsGalore in one place. Click through the workspace below.

Setup Lab
Study charts. Save the ones that matter.
01 / 05

Pull up any ticker, study the price action, mark it up, and save it to your database. Saving a setup automatically captures fundamental and technical data — including when the stock broke its moving averages — so you can slice it all in Analytics.

IREN · 1D · annotatetrendline · level · note
IREN daily chartFLAG BREAK
Any ticker, any timeframeAuto-saves MA & fundamentalsDrawings & annotations
New · Model Books

Turn any collection into a research-grade report.

Model Books compile your setups into a polished, shareable book — like an institutional research deck for your own playbook. Choose from 16 modular sections, drag to reorder, and generate.

  • Every trade, with its chartVisual case studies render each trade's annotated chart screenshot alongside its entry, exit, R-multiple, and your notes.
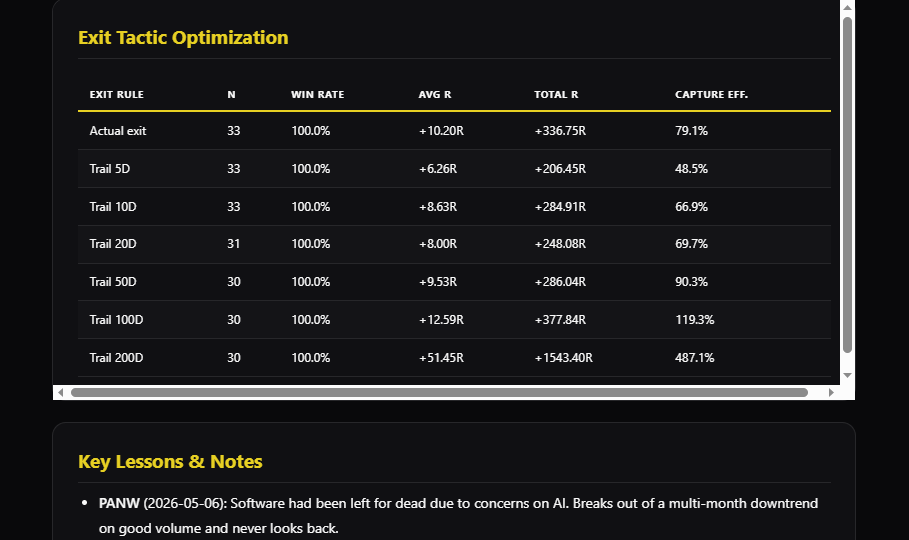
  • Exit-tactic optimizationSee your actual exit vs every trailing-stop rule, with capture efficiency on each.
  • Build your own sectionsAdd custom AI-generated analysis, reorder everything, and export a book you can publish or keep private.
View a sample model book →
Ask SetupsGalore
Analyzing Software Moves
Which setup performs best by expectancy?
Across Software Moves, your Flag Breakout setup leads on expectancy — +1.9R per trade at a 71% win rate. EP Day Entries are close behind.
Win rate
71%
Avg R
1.9R
Expectancy
+1.35R
What's my overall win rate and average R?How do my longs compare to my shorts?Which exit rule would have improved my results?
Ask about Software Moves…
Ask SetupsGalore

Ask your trade data anything.

Pick a collection and ask in plain English. Ask SetupsGalore computes answers from your playbook — no formulas, no pivot tables, no exports.

  • Grounded in your dataWin rate, setup expectancy, best-performing sector, longs vs shorts — answered from your actual trade log.
  • Custom calculations“Average R for trades held longer than 10 days,” “performance in uptrends vs downtrends” — just ask.
  • Suggested questionsSmart prompts tailored to each collection get you to insight in one click.
New · Community

Trading doesn't have to be lonely.

Share collections publicly, find and follow other traders, and fork their best playbooks straight into your own binder. The social layer for discretionary traders is here.

  • Share & fork collectionsPublish playbooks or keep them private. Fork any public collection into your own workspace in one click.
  • Find & follow tradersSearch by name, follow whoever you like, and see their public setups land in your feed.
  • LeaderboardsTop traders, strongest track records, and what's trending now — with verified stats.
Community · Leaderboard
Top traders Performance Trending
1@apex_swingsSwing · 142 trades indexed★ 248↗ 36◴ 312
2B@breakout_benSwing · Flag breakouts★ 191↗ 28◴ 204
3C@crypto_caroCrypto · Memecoin EPs★ 173↗ 21◴ 188
V@vol_veraVolatility · IV regimes · 3 followersFollow
T@trend_theoPosition · Stage-2 markups · 5 followersFollowing

The fundamentals,
done properly.

Capture setups, review evidence, and surface the signals that keep showing up — without fighting spreadsheets or screenshot folders.

01

Digital Binder

Replace Excel spreadsheets and screenshot folders with organized, queryable collections of your trades.

02

Analytics Engine

Win rates, R-multiples, and performance distributions sliced by setup, sector, timeframe, and more.

03

Visual Archive

Charts saved from the Setup Lab flow into a clean gallery. Star your best trades, launch slideshows, jump to detail in one click.

04

Model Books

Turn any collection into a research-grade report — with a visual case study and chart for every single trade.

05

Ask SetupsGalore

Ask your trade data anything in plain English. Win rate, expectancy, best exit — computed from your real trades.

06

Community & Sharing

Share collections publicly or keep them private. Follow other traders and fork their playbooks into your own binder.

Designed around how
discretionary traders think.

Whether you trade breakouts, pivots, crypto, or long-term accumulation — SetupsGalore adapts to your process, not the other way around.

For the Day Trader

Archive intraday patterns and scalping setups

  • Track volume spikes, gaps, and intraday momentum setups
  • Document pre-market and after-hours setups
  • Analyze which timeframes work best for your style
  • Tag and review every scalp without breaking flow
5m TIMEFRAME · STUDY VIEWsetup ★★★★★
5m chart

Model books & case studies
from inside the platform.

Real research, built on SetupsGalore. See how traders turned a folder of screenshots into a measurable, repeatable edge.

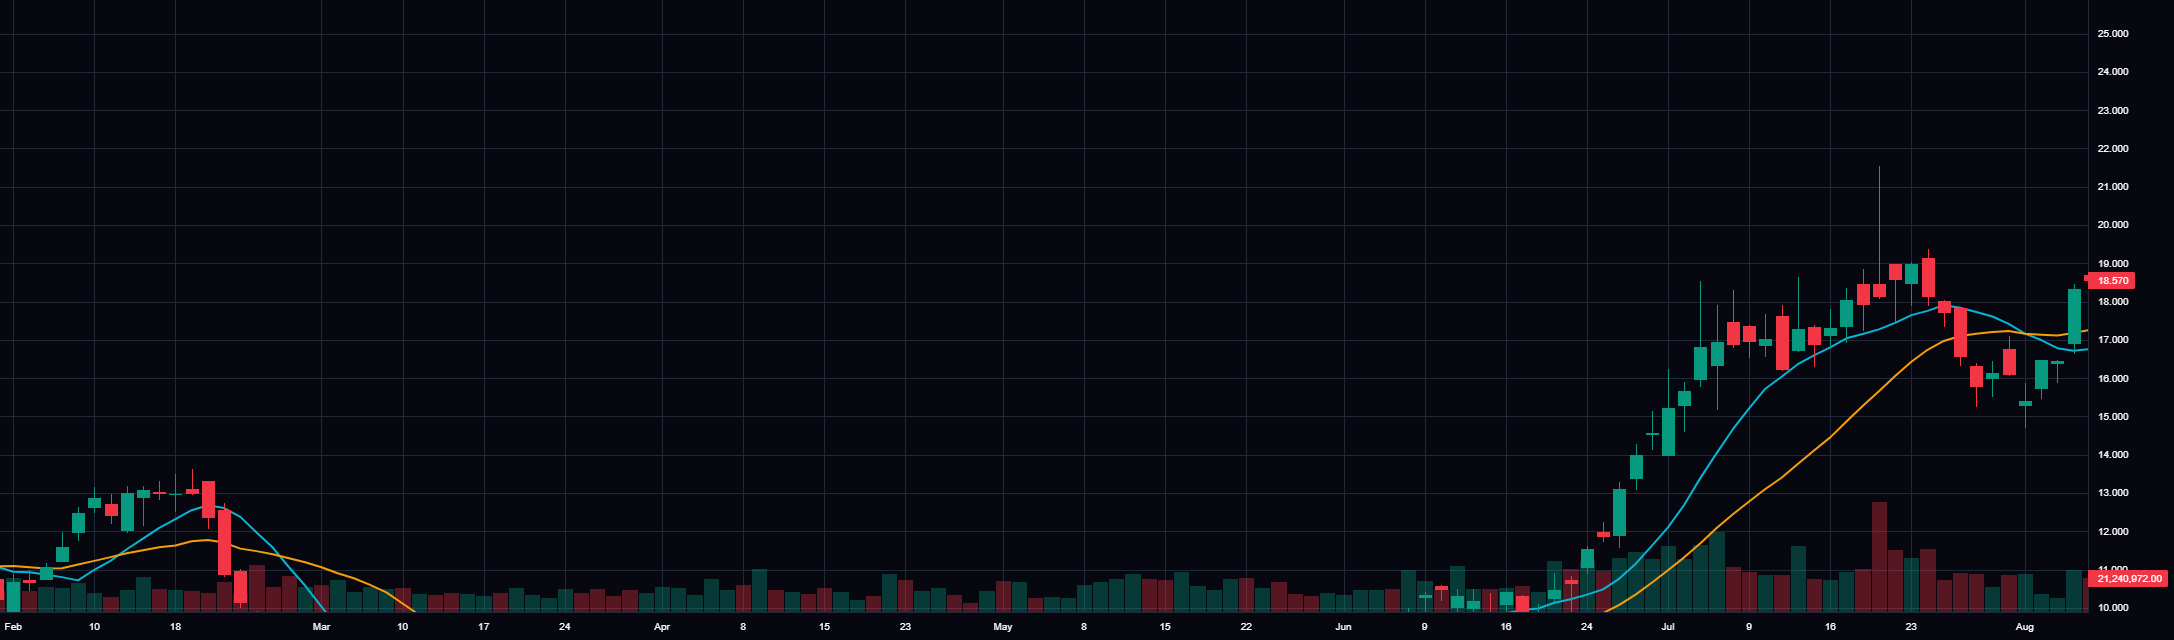
Software Moves model book chartMODEL BOOK · LIVE+336R total
Exit Study · 33 software breakouts

What 33 software breakouts taught me about exits

My actual exits captured 79% of the available move. The exit-tactic optimizer showed a 50-day trailing stop would have pushed capture efficiency past 90% — without lowering the win rate.

SetupsGalore TeamRead model book →

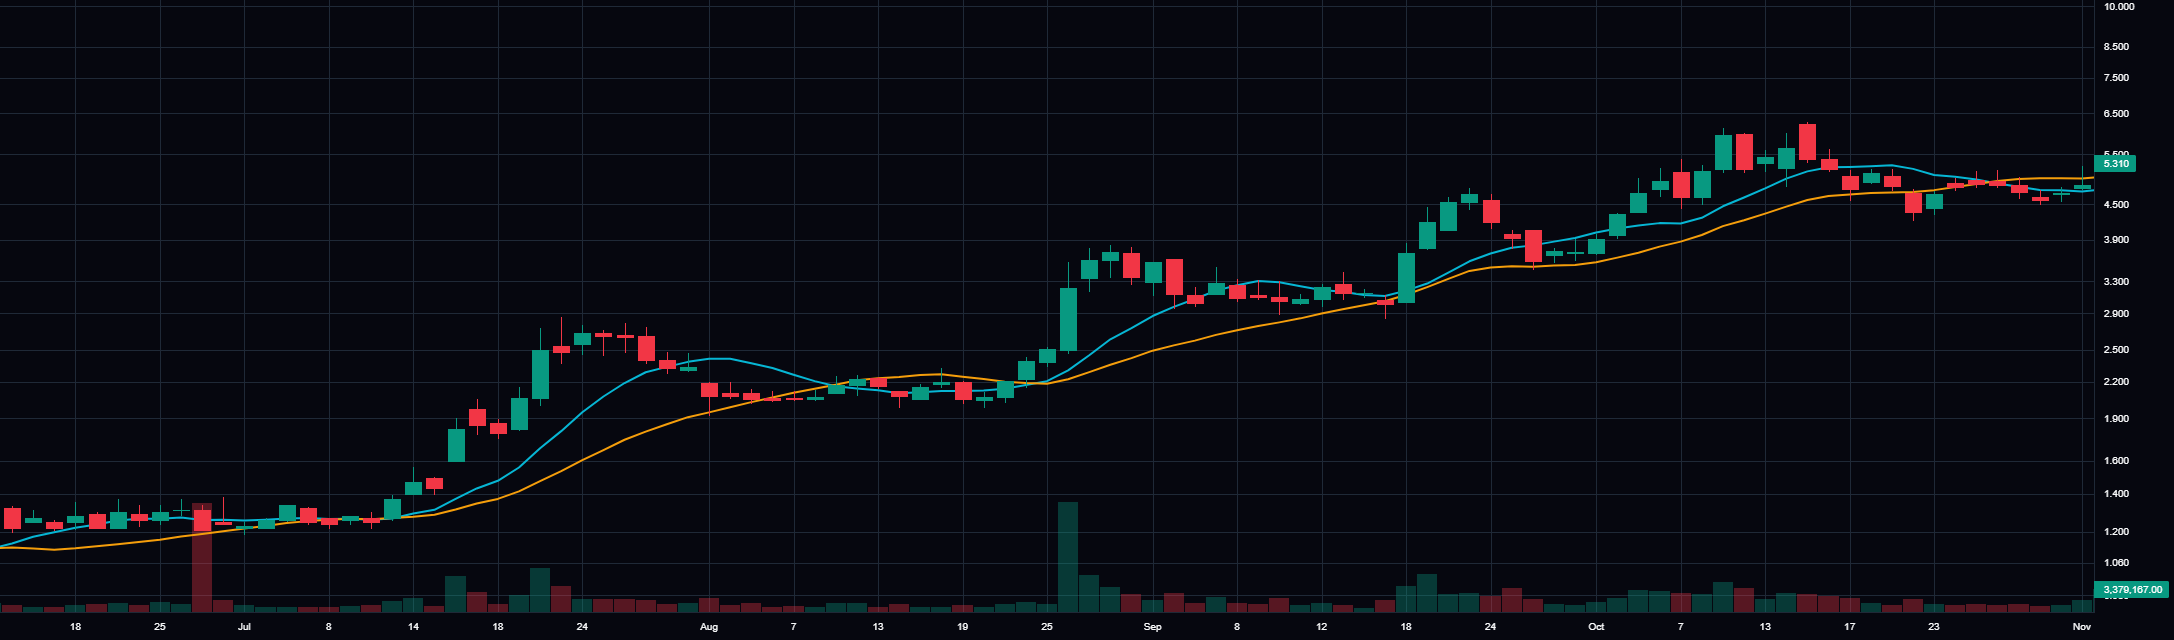
SOXL semiconductor ETF breakout chartMODEL BOOK · LIVE+189R total
Leverage Study · 10 semiconductor breakouts

Does levered exposure actually pay? SOXL vs SOXX

Ten matched semiconductor breakouts, SOXL against SOXX on identical dates. The levered ETF added +4.06R per trade on average — at 1.7× the variance. A 20-day trailing stop kept nearly all the edge.

SetupsGalore TeamRead model book →

More insights coming soon. Want your model book featured here? Submit a case study →

Questions, answered.

Everything you need to know about turning your trades into a measurable edge with SetupsGalore.

What is SetupsGalore?

A visual trade research platform. Capture chart screenshots and trade context into organized collections, then study win rates, R-multiples, and repeatable patterns with an analytics engine, Ask SetupsGalore, and shareable Model Books.

What is a Model Book?

A research-grade report generated from any collection — executive summary, setup performance matrix, exit-tactic optimization, risk profiling, visual case studies, and more. You choose which of 16 sections to include and reorder them.

Does Ask SetupsGalore use my real trades?

Yes. Pick a collection and ask in plain English — win rate, setup expectancy, best exit rule, performance by sector or market regime. Every answer is computed from your actual trade data.

Can I share setups with other traders?

Make collections public, follow other traders, fork their playbooks into your own binder, and climb verified leaderboards. Collections stay private by default until you choose to publish.

Who is it for?

Discretionary traders of every style — day, swing, options, crypto, and position traders — who want to turn screenshots and notes into a measurable, repeatable edge.

Is my data private?

Collections are private by default. You decide what to make public, share via read-only links, or publish to the community feed. You stay in control of every trade you log.

Is SetupsGalore a trade journaling software?

No. SetupsGalore is not a post-mortem trade journal.

Traditional journals are backward-looking — you import your past broker data to analyze what you already did wrong.

SetupsGalore is a forward-looking pattern-recognition engine. Instead of auditing your mistakes after the fact, our platform is built to help you study historical market cycles, build curated Model Books, and train your visual memory. It is a procedural tool designed to help you find high-probability setups, optimize your mechanical trailing exits based on hard data, and recognize structural institutional footprints before you put capital to work.

Ready to build
your edge?

Join discretionary traders turning their visual patterns into quantifiable strategies.