
Dynamic Portfolio Analytics & Visual Model Book
Activate your edge.
Processed via SetupsGalore Core Engine — generated June 20, 2026
Table of Contents
- Visual Trade Case Studies
- Exit Tactic Optimization
- Key Lessons & Notes
Visual Trade Case Studies
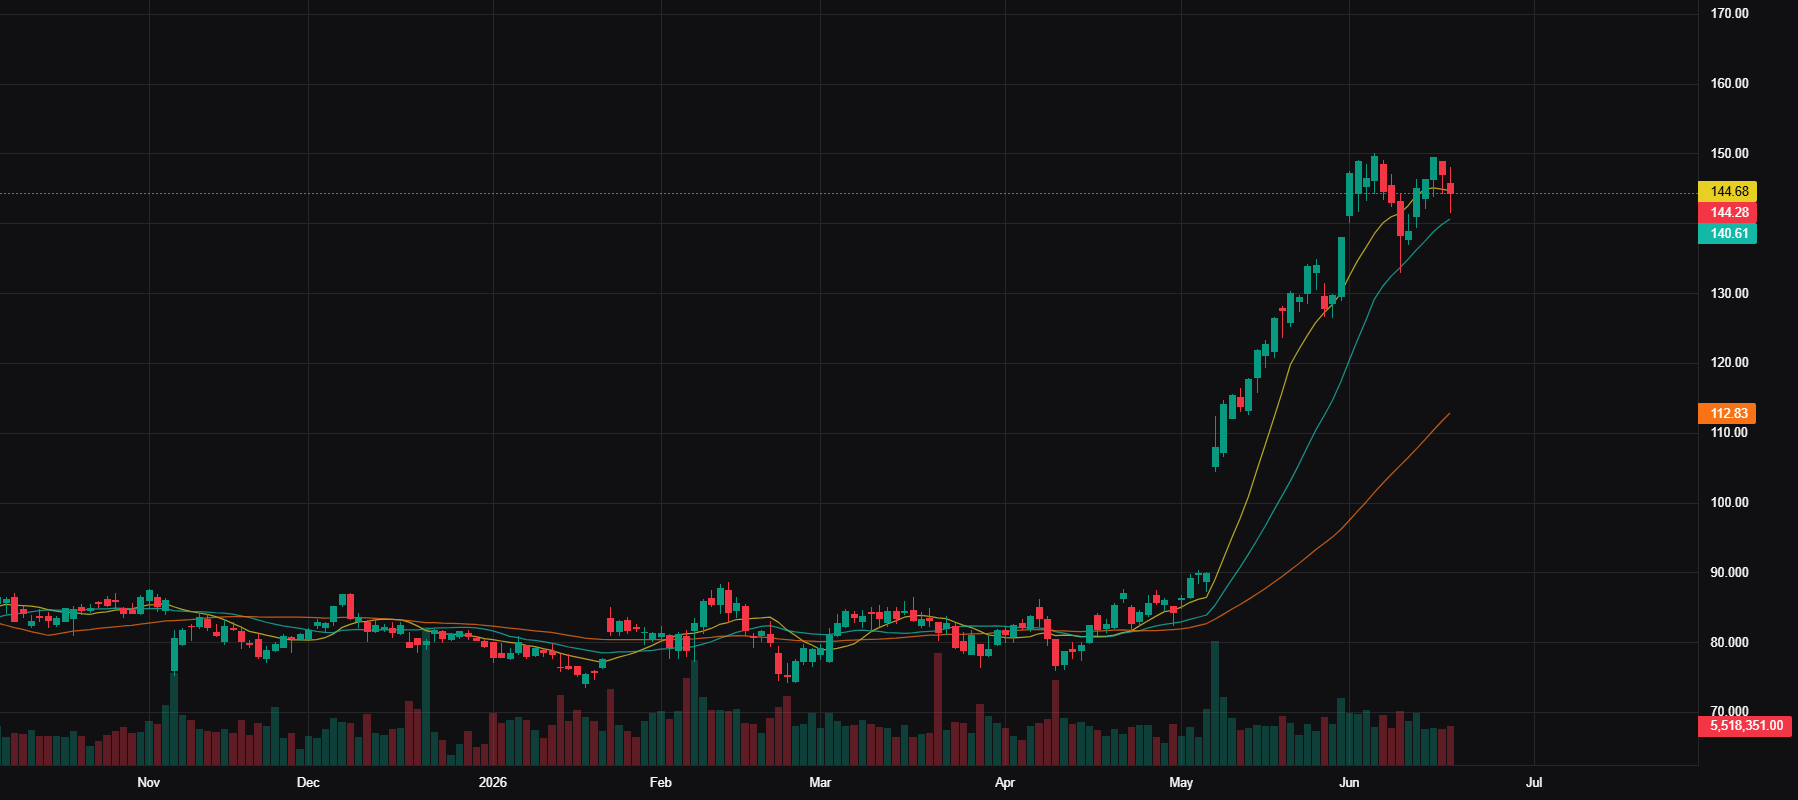
FTNT — 2026-05-05 — — — —
Execution: Entry $88.70 | Exit $143.04 | Stop $87.29 | +38.54R | 33 days | 0.6%
Context: Vol 142.4× 20d avg | ADR 3.0% | Mkt Cap $64.99B
Notes: Earnings come in better than expected and feared (AI concerns) and stock rerates pretty quickly.
Advanced Chart
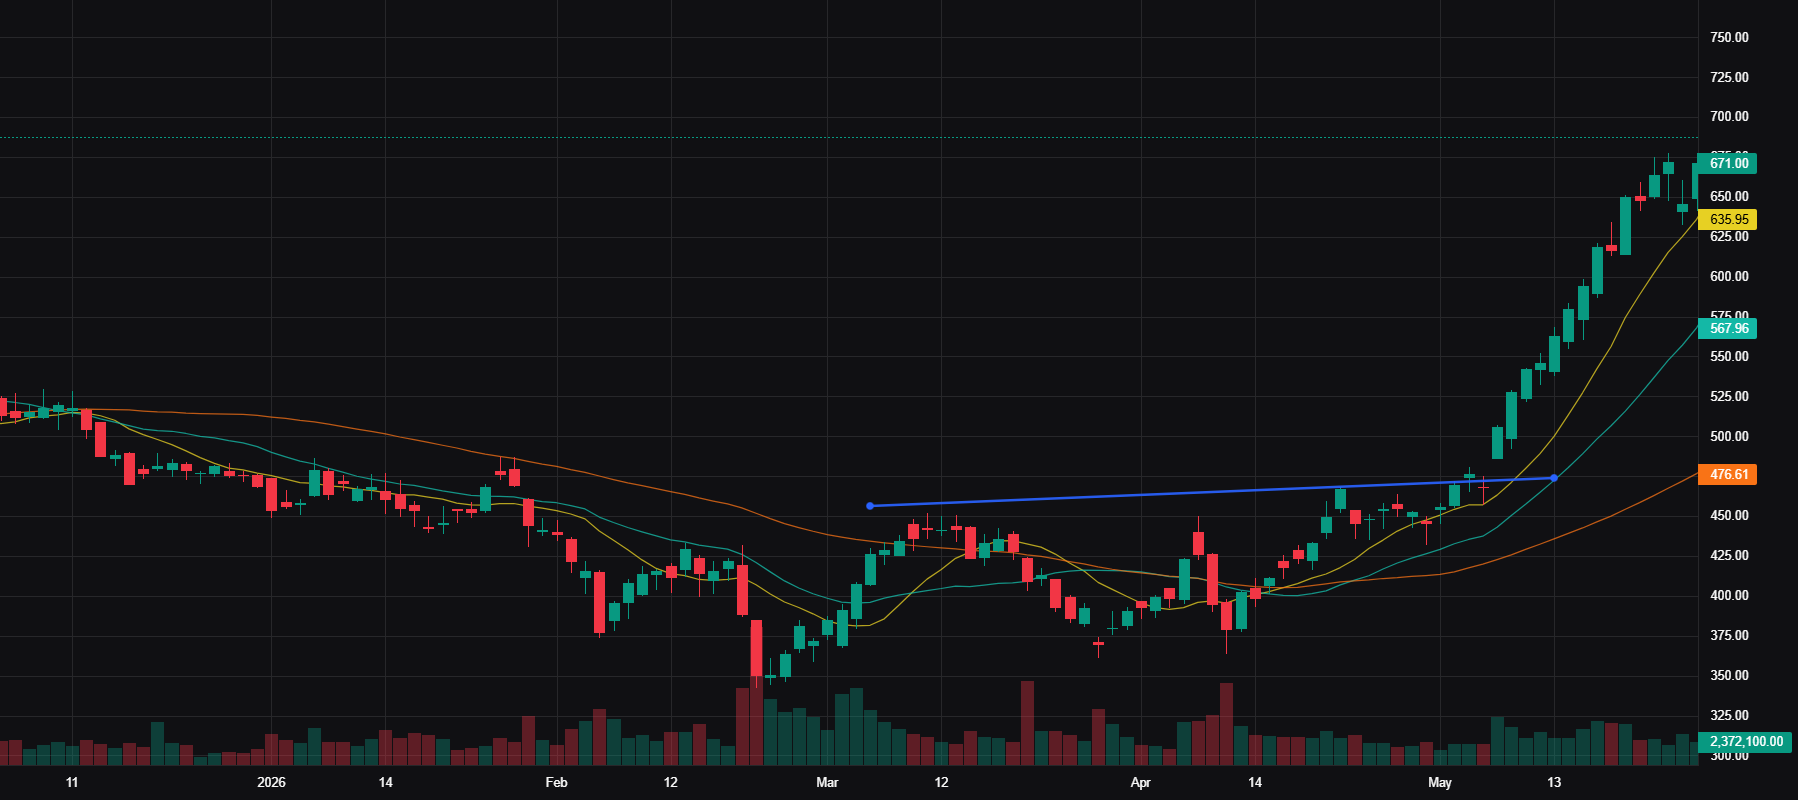
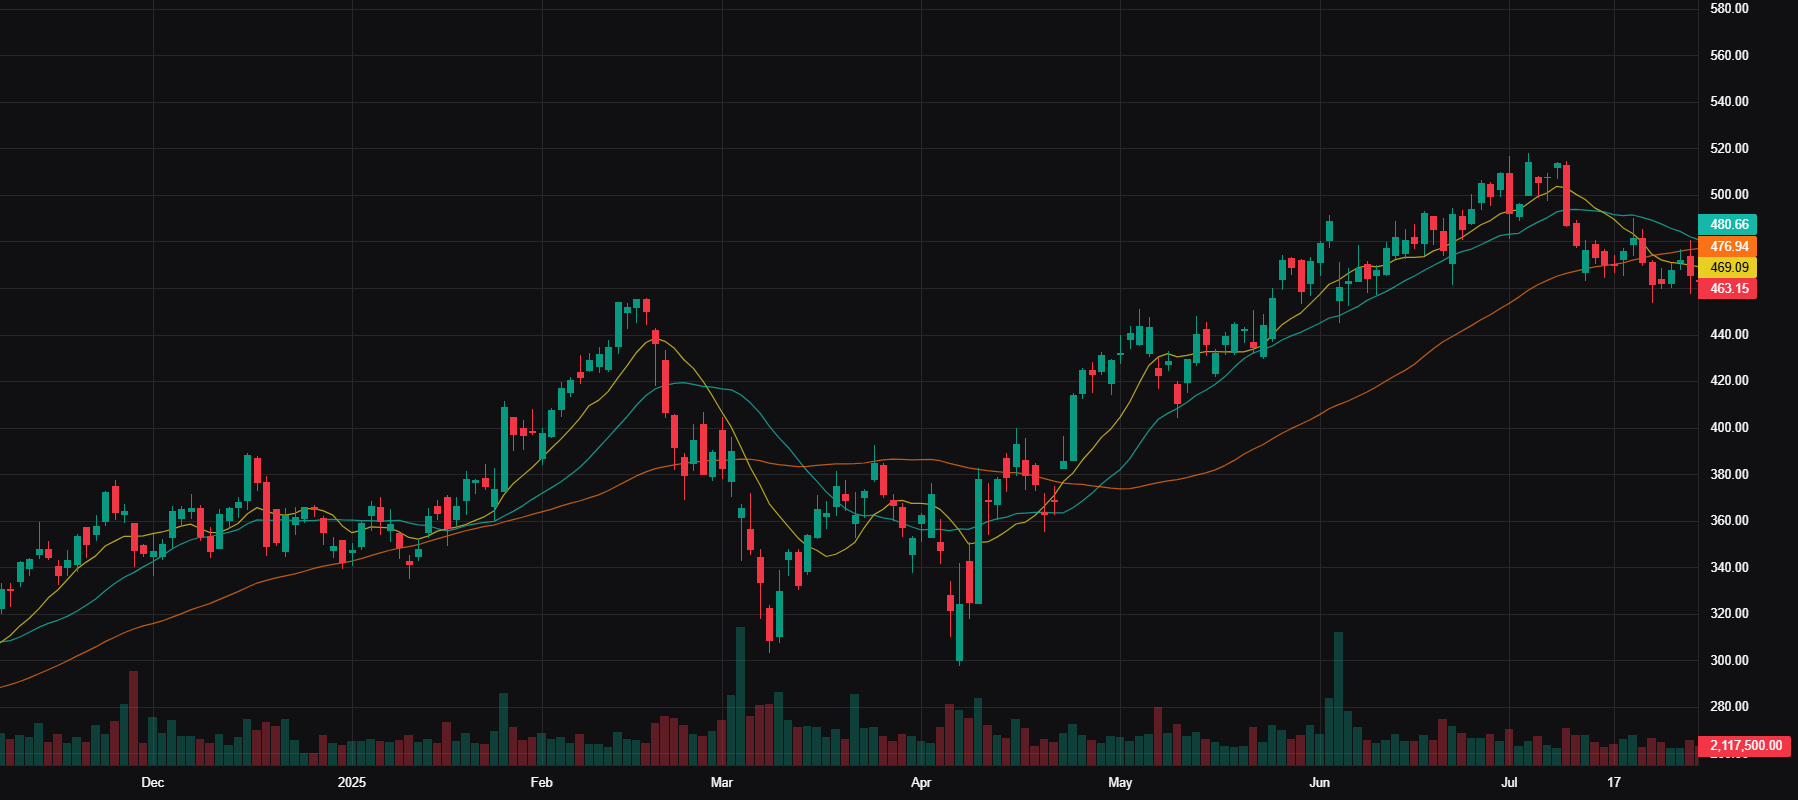
CRWD — 2026-05-04 — Flag Breakout — long
Execution: Entry $463.61 | Exit $719.09 | Stop $455.40 | +31.14R | 31 days | 0.6%
Context: Vol 64.9× 20d avg | ADR 3.4% | Mkt Cap $118.02B
Advanced Chart
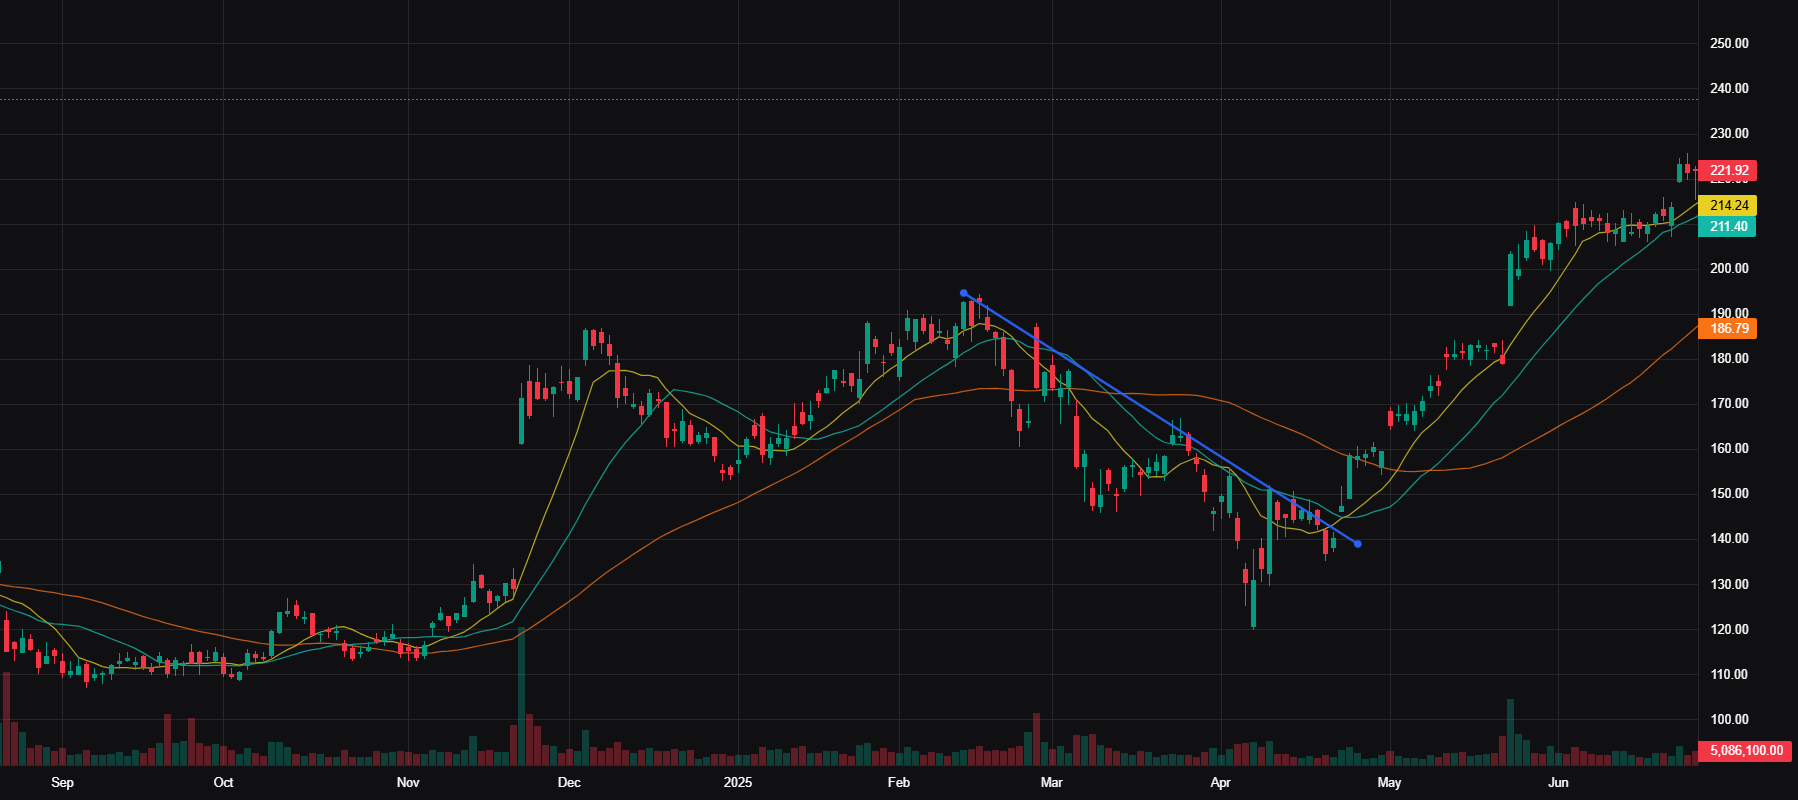
SNOW — 2025-04-22 — Downtrend break — long
Execution: Entry $139.43 | Exit $203.18 | Stop $137.36 | +30.87R | 30 days | 0.5%
Context: Vol 57.9× 20d avg | ADR 6.5% | Mkt Cap $48.32B
Advanced Chart
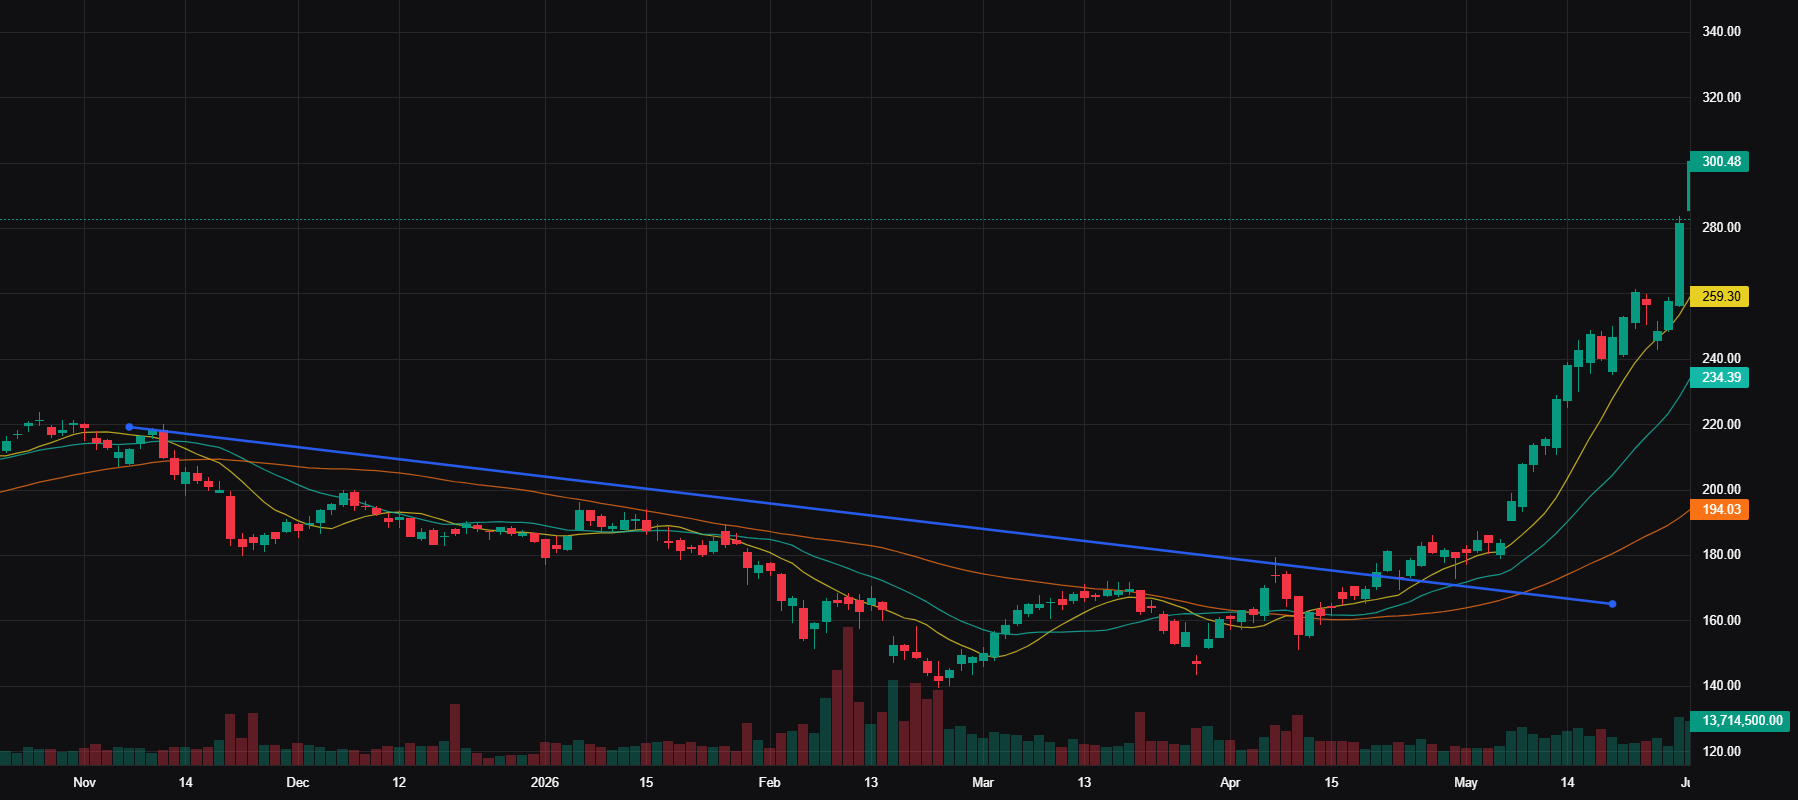
PANW — 2026-05-06 — — — —
Execution: Entry $194.93 | Exit $266.33 | Stop $190.77 | +17.16R | 32 days | 0.4%
Context: Vol 152.8× 20d avg | ADR 3.6% | Mkt Cap $158.87B
Notes: Software had been left for dead due to concerns on AI. Breaks out of a multi-month downtrend on good volume and never looks back.
Advanced Chart
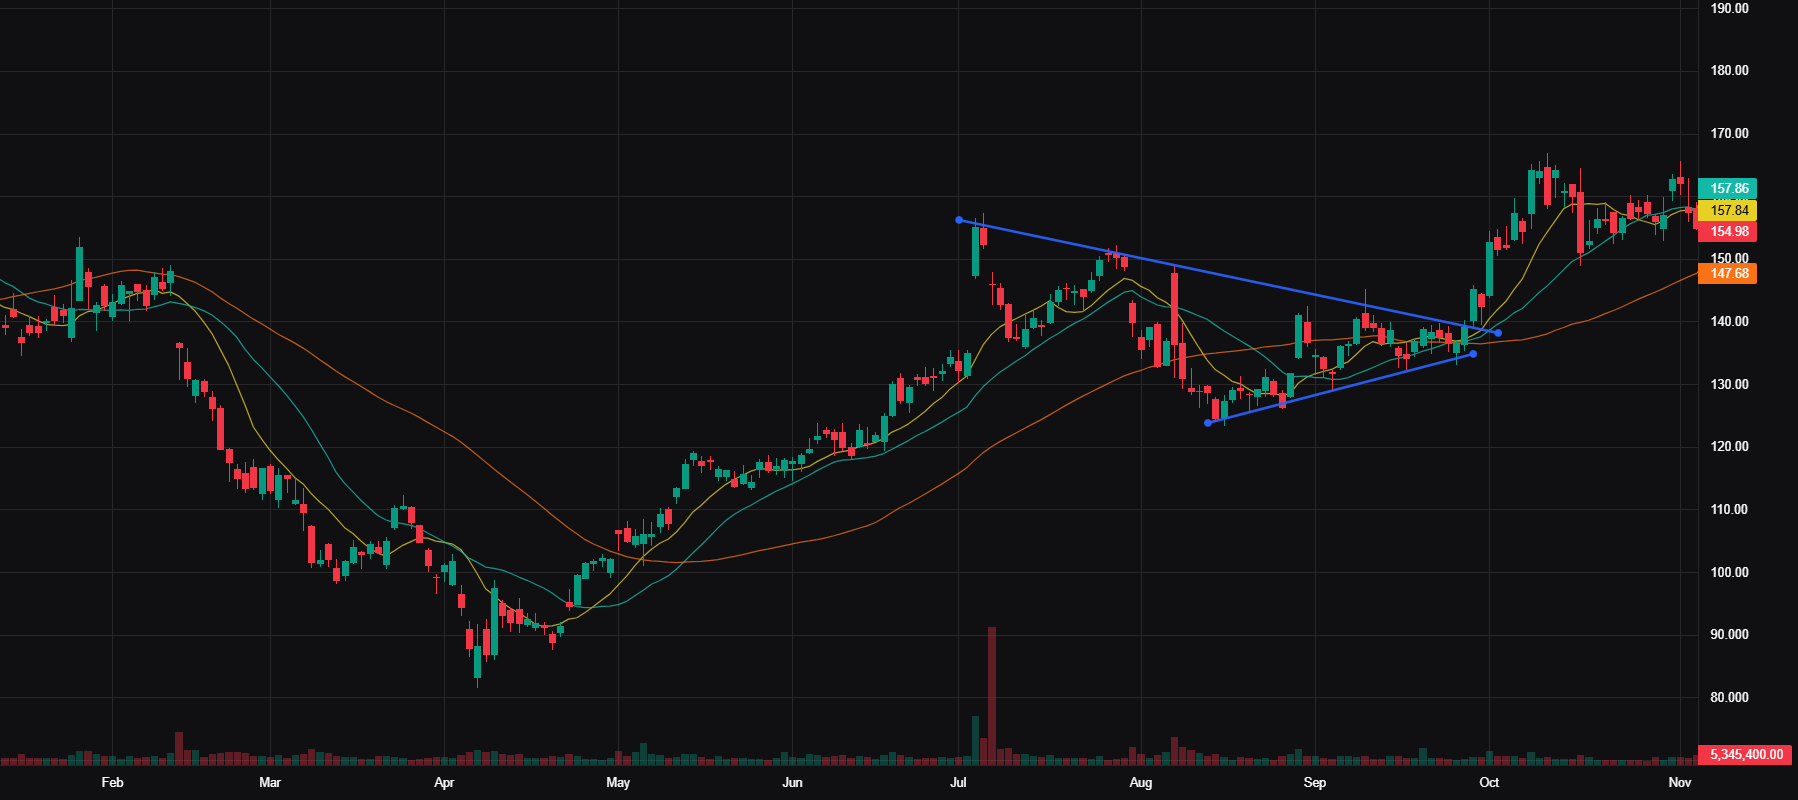
NOW — 2023-10-30 — Range breakout — long
Execution: Entry $113.03 | Exit $137.15 | Stop $111.62 | +17.13R | 31 days | 0.2%
Context: Vol 114.7× 20d avg | ADR 3.2% | Mkt Cap $116.56B
Advanced Chart
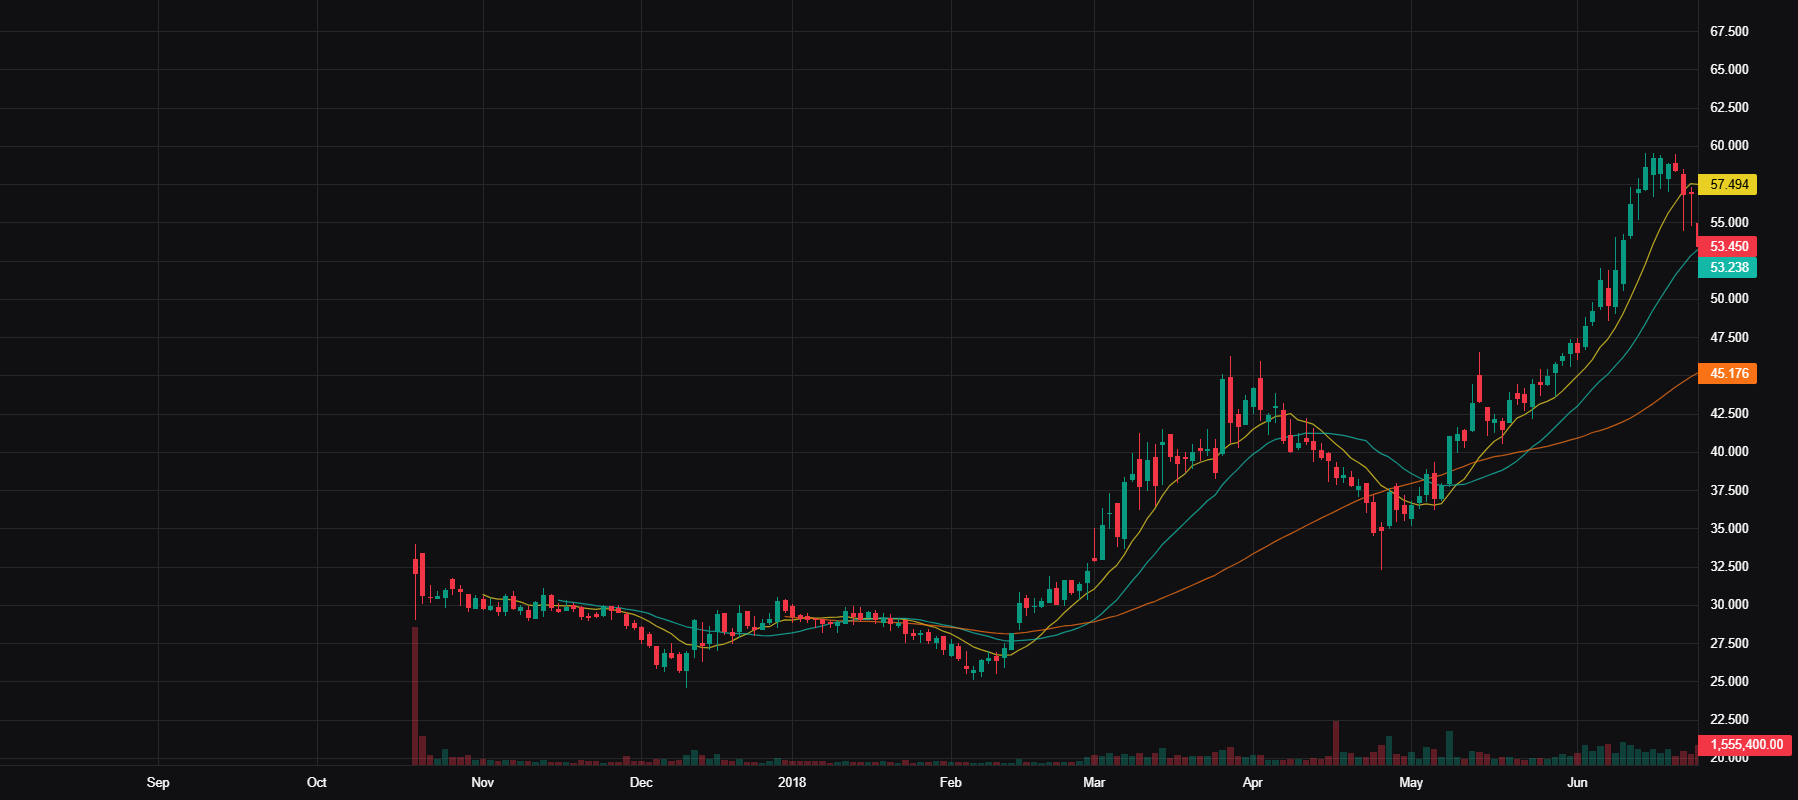
MDB — 2018-05-18 — Tight Day breakout — long
Execution: Entry $42.95 | Exit $59.20 | Stop $41.94 | +16.17R | 31 days | 0.4%
Context: Vol 55.0× 20d avg | ADR 5.1% | Mkt Cap $3.45B
Advanced Chart
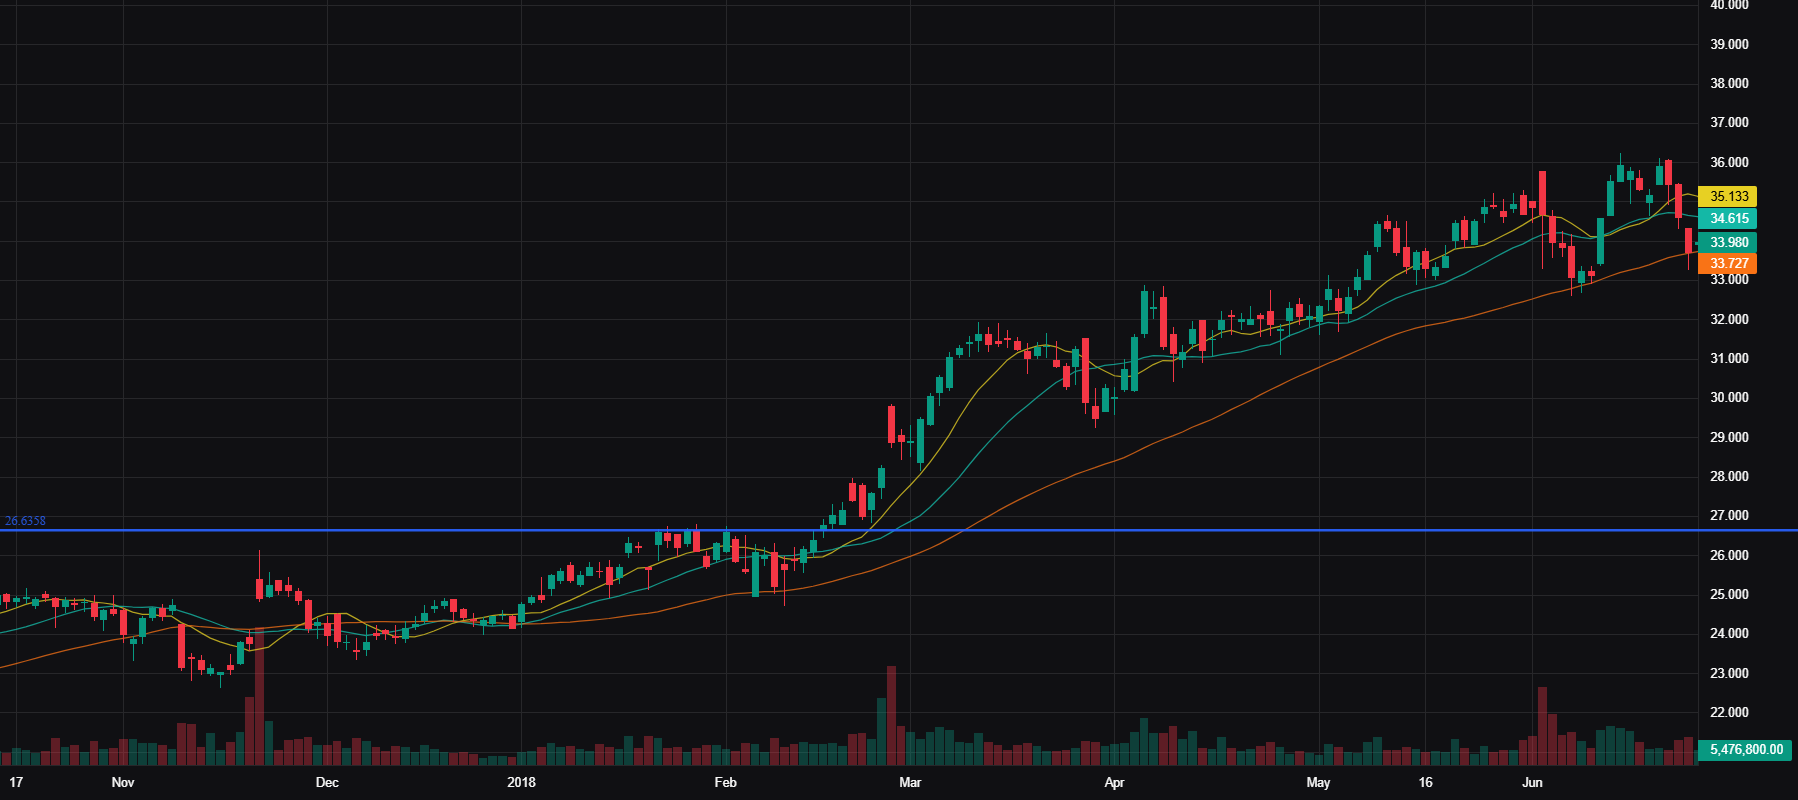
PANW — 2018-02-14 — Base Breakout — long
Execution: Entry $26.30 | Exit $31.41 | Stop $25.96 | +14.95R | 28 days | 0.2%
Context: Vol 106.8× 20d avg | ADR 3.0% | Mkt Cap $21.43B
Advanced Chart
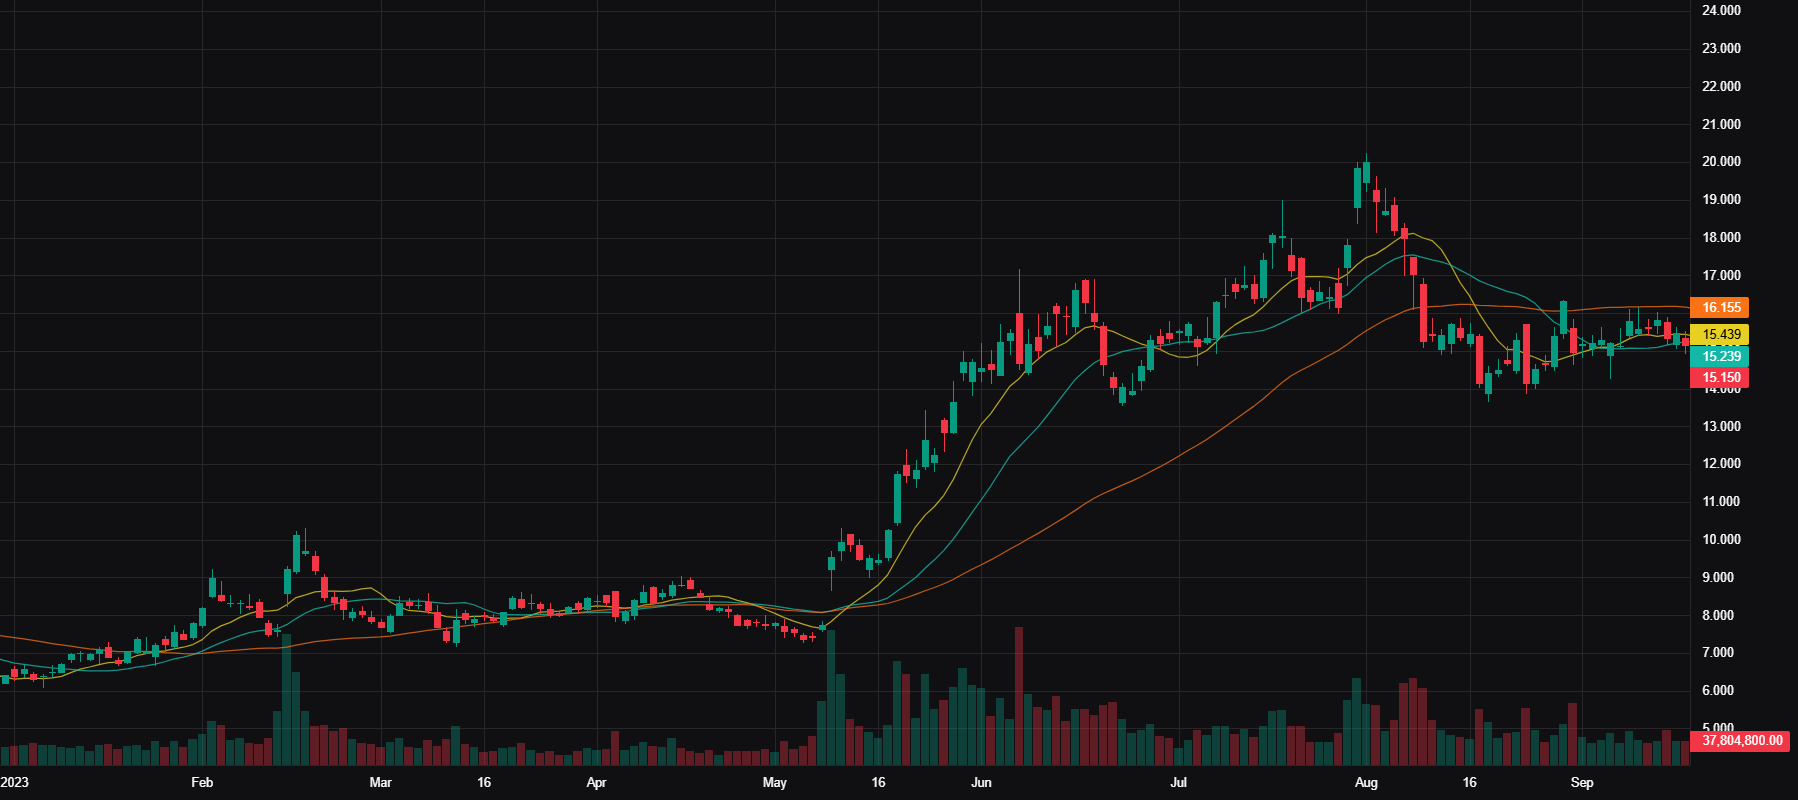
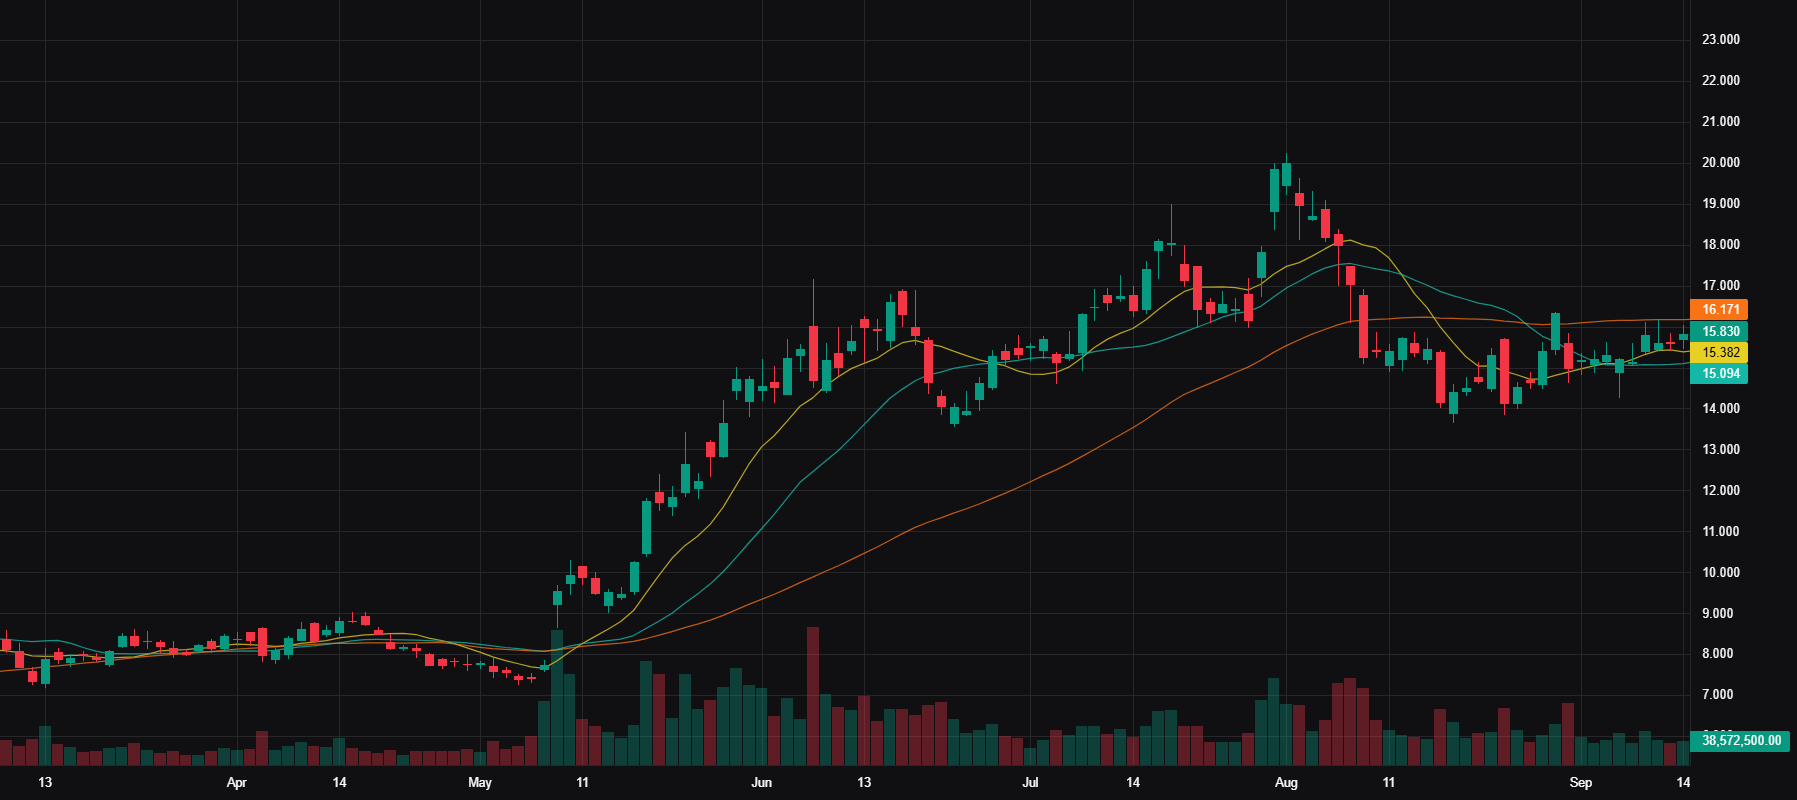
PLTR — 2023-05-17 — Tight Day breakout — long
Execution: Entry $9.87 | Exit $15.79 | Stop $9.46 | +14.35R | 34 days | 0.6%
Context: Vol 118.3× 20d avg | ADR 5.4% | Mkt Cap $22.67B
Advanced Chart
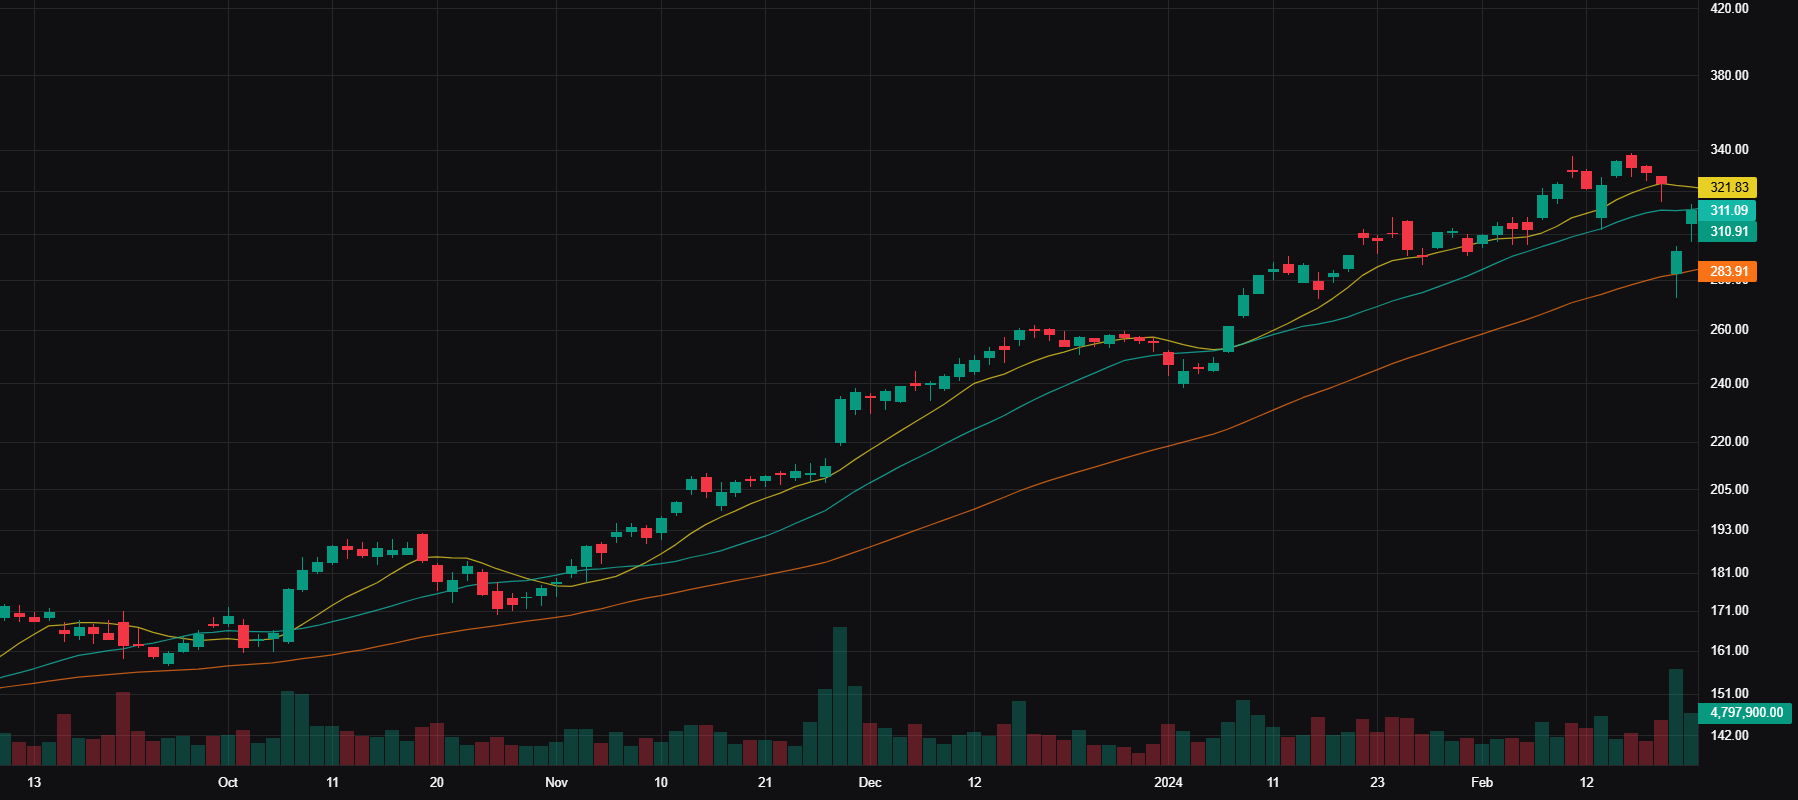
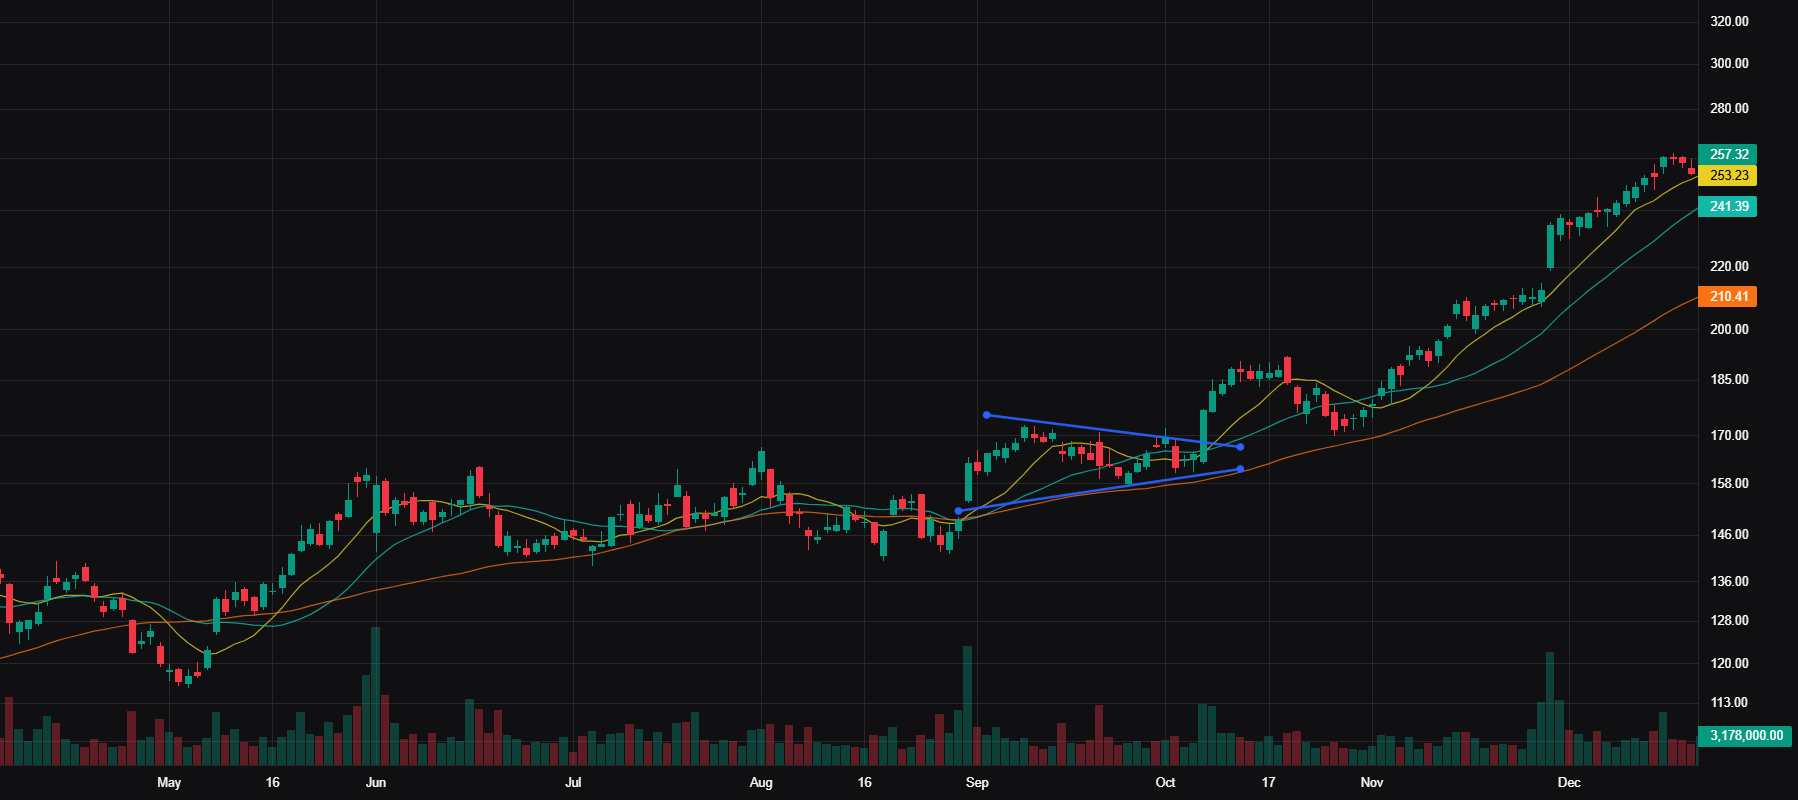
CRWD — 2024-01-08 — Undercut n Rally — long
Execution: Entry $256.60 | Exit $323.04 | Stop $251.56 | +13.18R | 31 days | 0.3%
Context: Vol 146.7× 20d avg | ADR 2.3% | Mkt Cap $65.32B
Advanced Chart
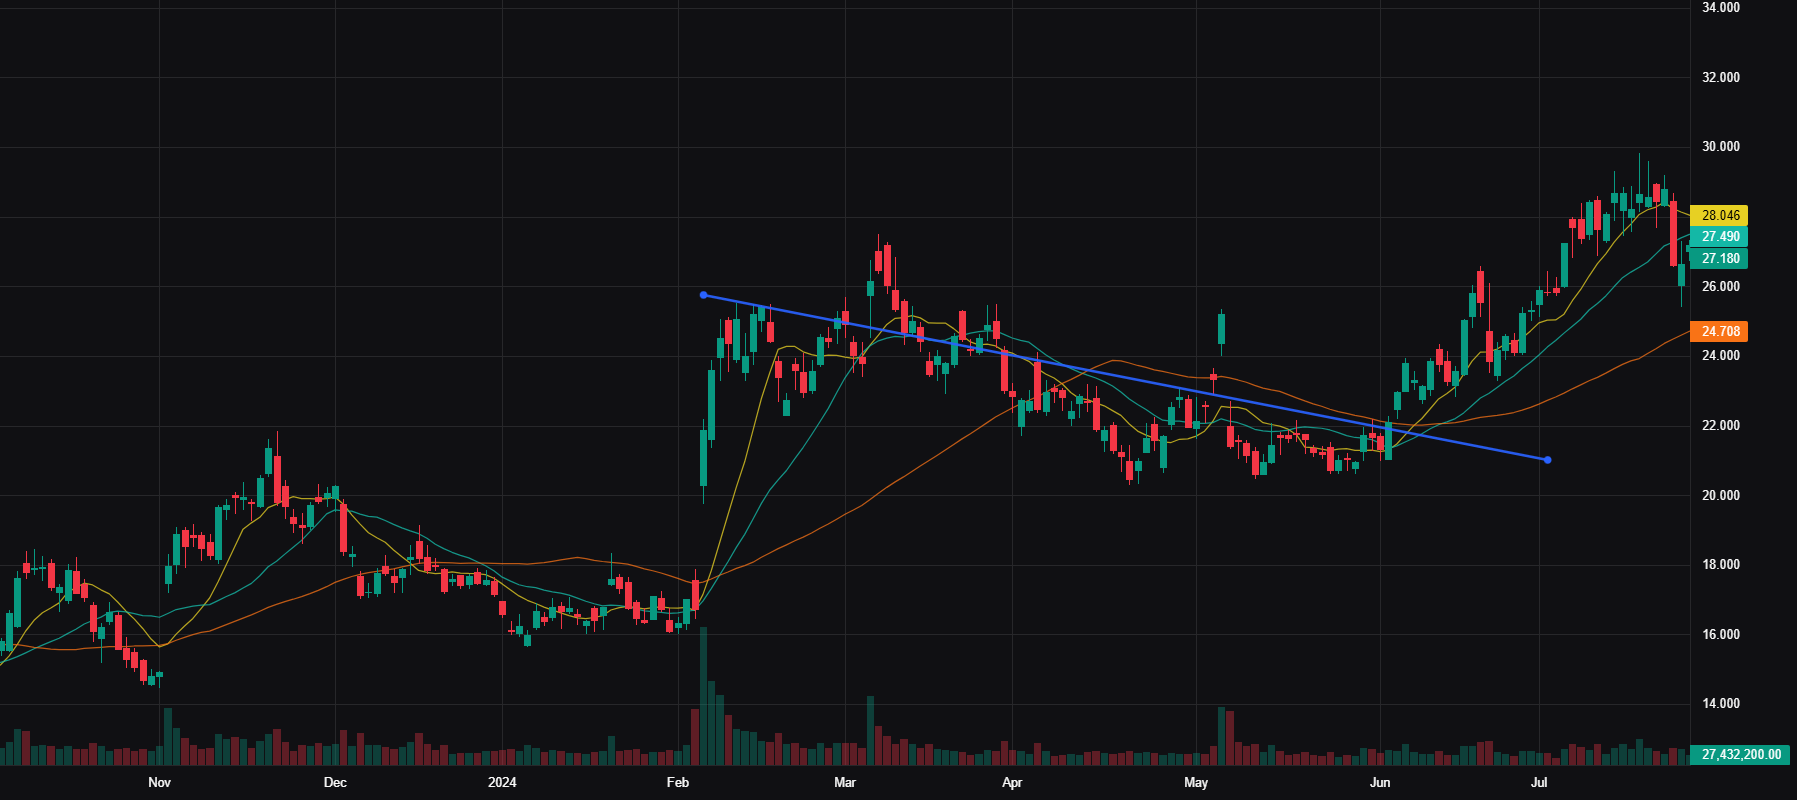
PLTR — 2024-06-04 — — — —
Execution: Entry $22.60 | Exit $27.23 | Stop $22.22 | +12.18R | 30 days | 0.2%
Context: Vol 102.2× 20d avg | ADR 3.0% | Mkt Cap $51.89B
Notes: Comes out of a multi-month digestion after an EP re-rating. Had some fake breakouts to shake weak hands, but once broken, there were spots to add as well.
Advanced Chart
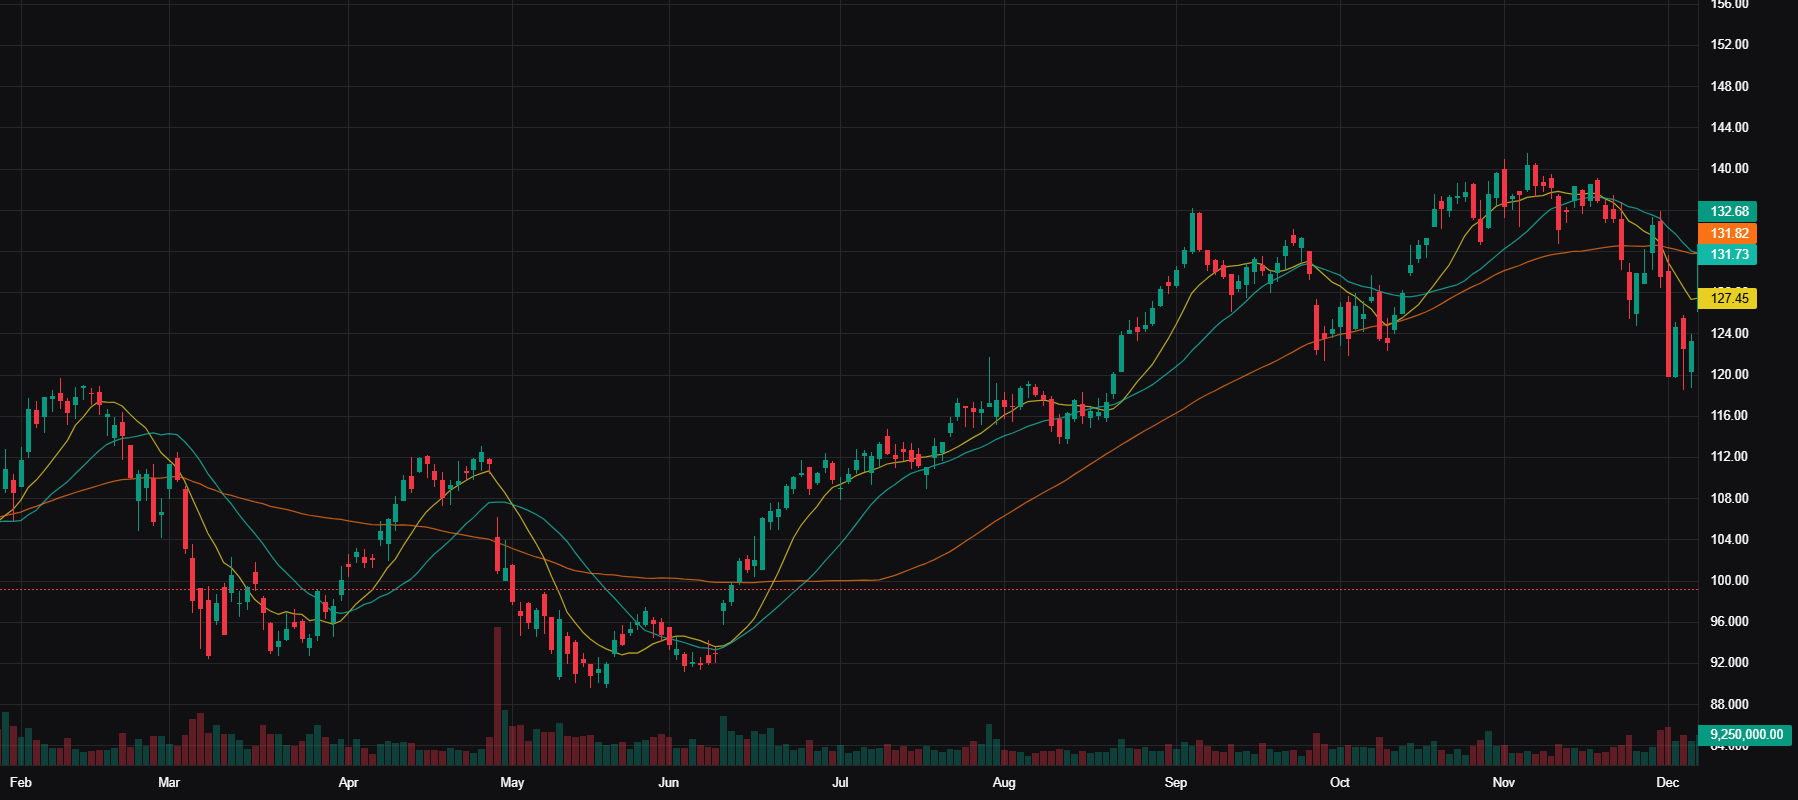
CRWD — 2024-11-05 — — — —
Execution: Entry $320.71 | Exit $365.65 | Stop $316.75 | +11.36R | 30 days | 0.1%
Context: Vol 119.9× 20d avg | ADR 3.1% | Mkt Cap $81.64B
Notes: Beautiful 3-month sideways range with some shakeouts along the way. A bit difficult to find a tight spot for entry but the break of range was a tell-tale sign.
Advanced Chart
PLTR — 2023-05-09 — EP Day Entry — long
Execution: Entry $9.17 | Exit $15.02 | Stop $8.65 | +11.30R | 31 days | 0.6%
Context: Vol 559.5× 20d avg | ADR 4.2% | Mkt Cap $21.06B
Advanced Chart

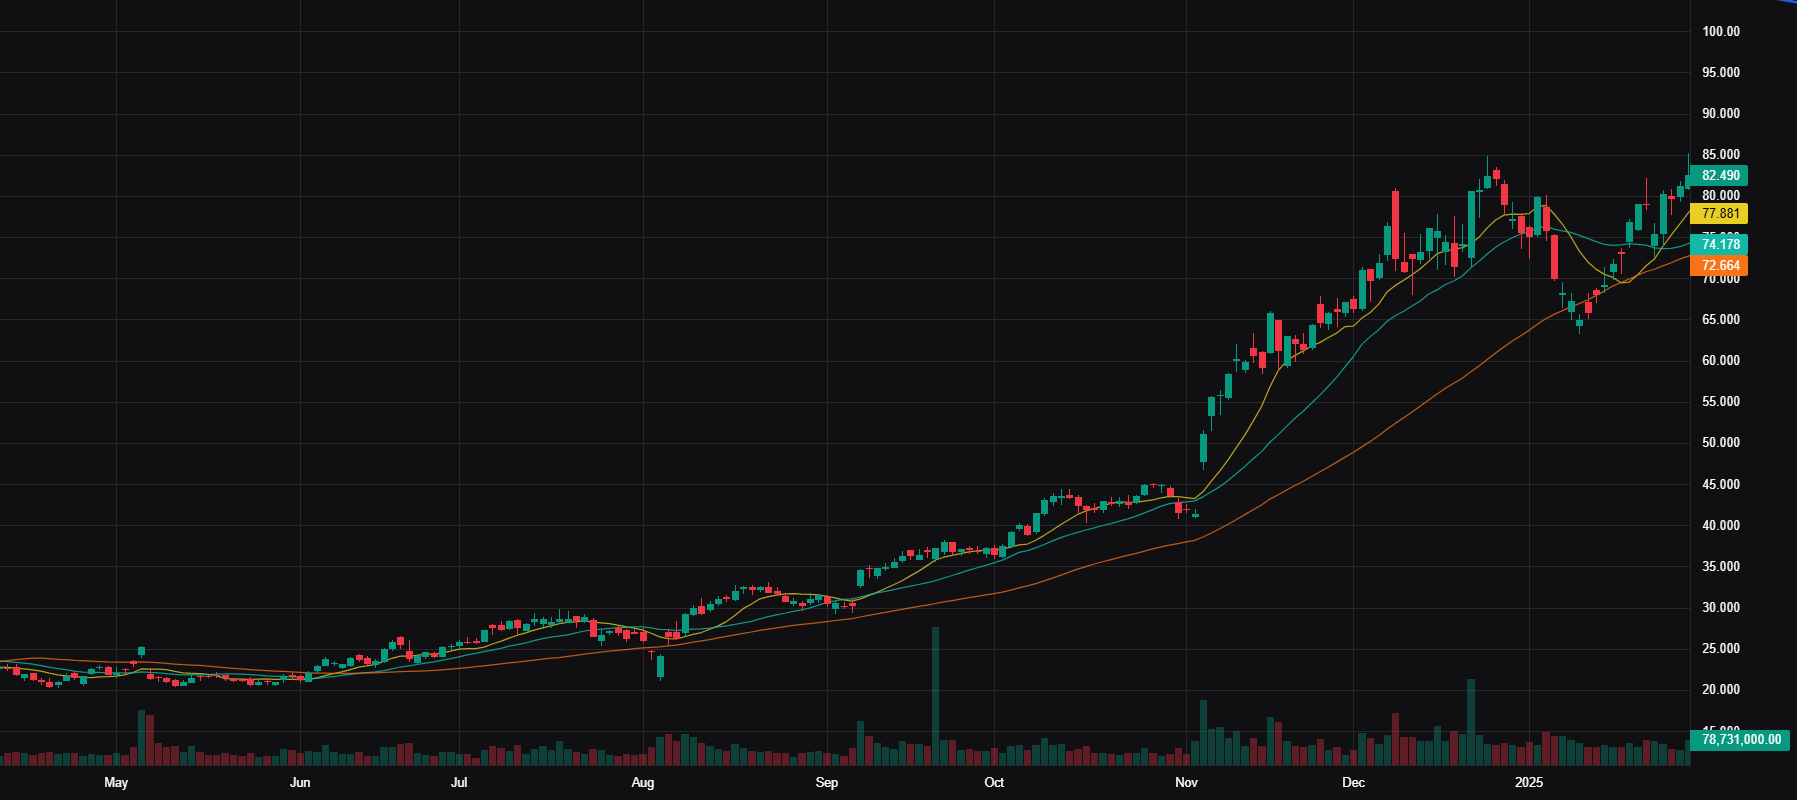
PLTR — 2024-11-05 — EP Day Entry — long
Execution: Entry $49.22 | Exit $71.87 | Stop $46.86 | +9.61R | 30 days | 0.5%
Context: Vol 389.2× 20d avg | ADR 3.4% | Mkt Cap $113.01B
Advanced Chart
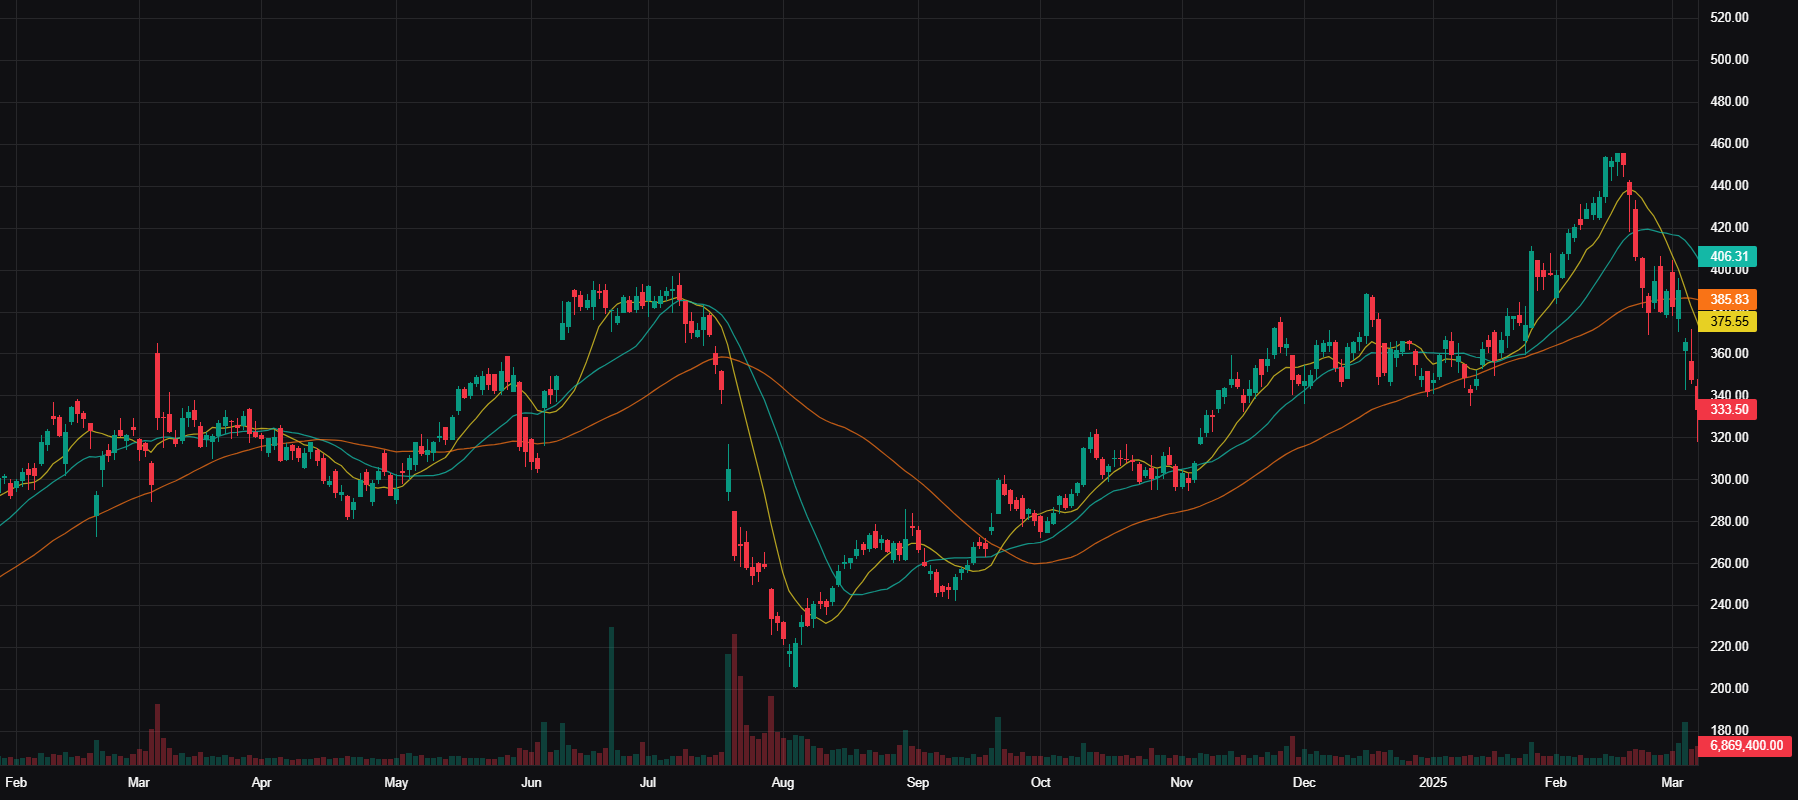
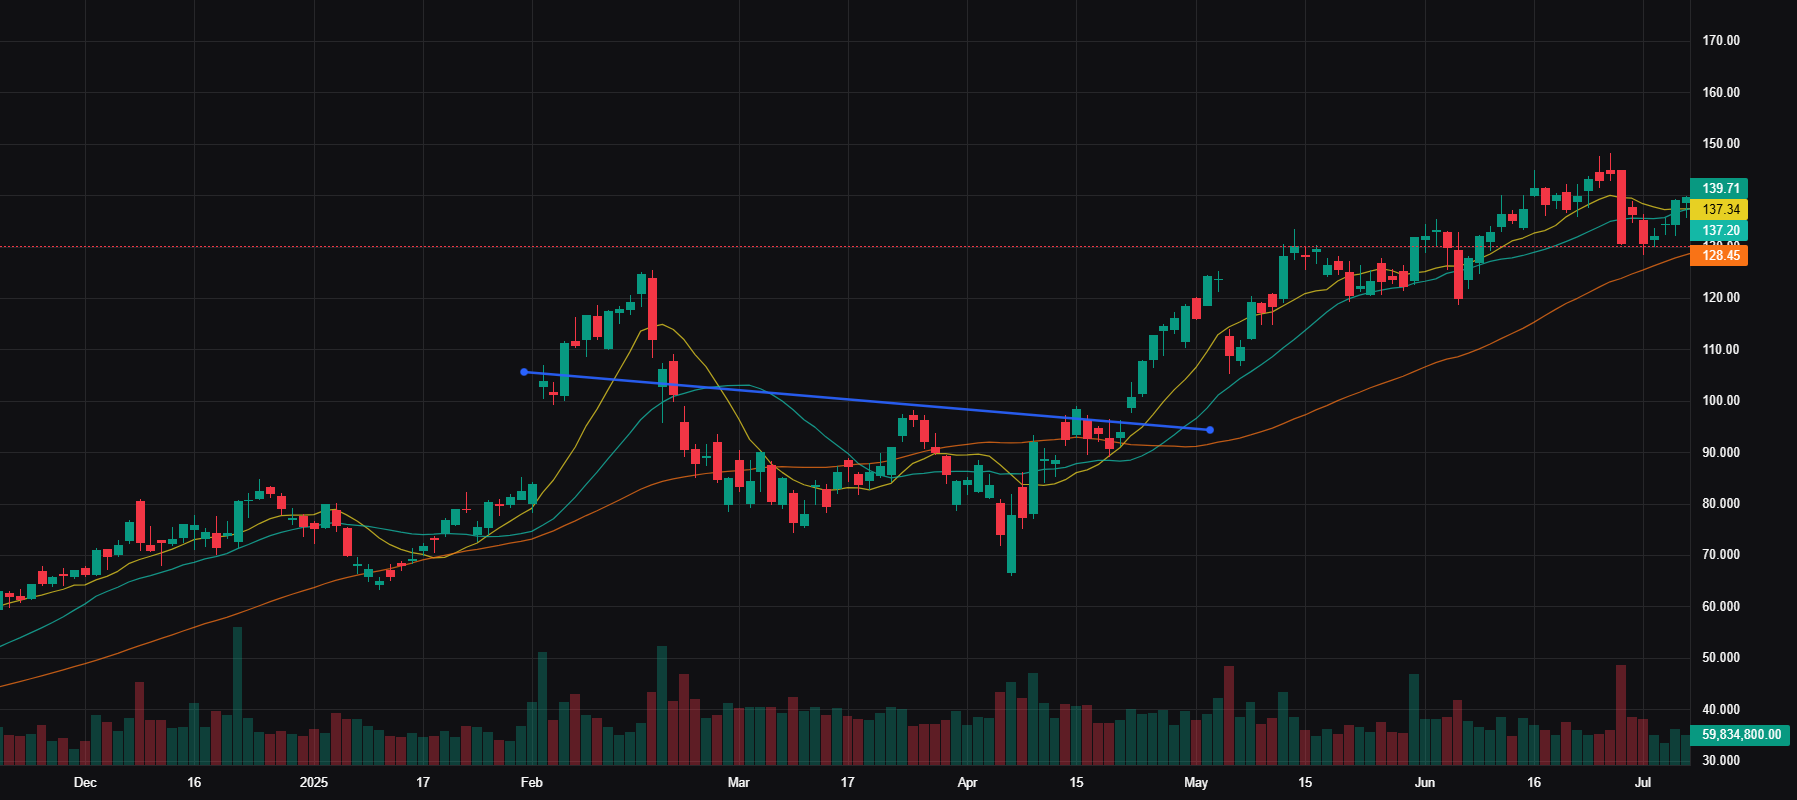
CRWD — 2025-04-22 — — — —
Execution: Entry $389.40 | Exit $455.59 | Stop $382.50 | +9.59R | 30 days | 0.2%
Context: Vol 89.5× 20d avg | ADR 7.0% | Mkt Cap $99.13B
Notes: Not super clean but shook out a lot of people on the second test of 300, once broken above its recent range it continued its uptrend and broke to new highs.
Advanced Chart
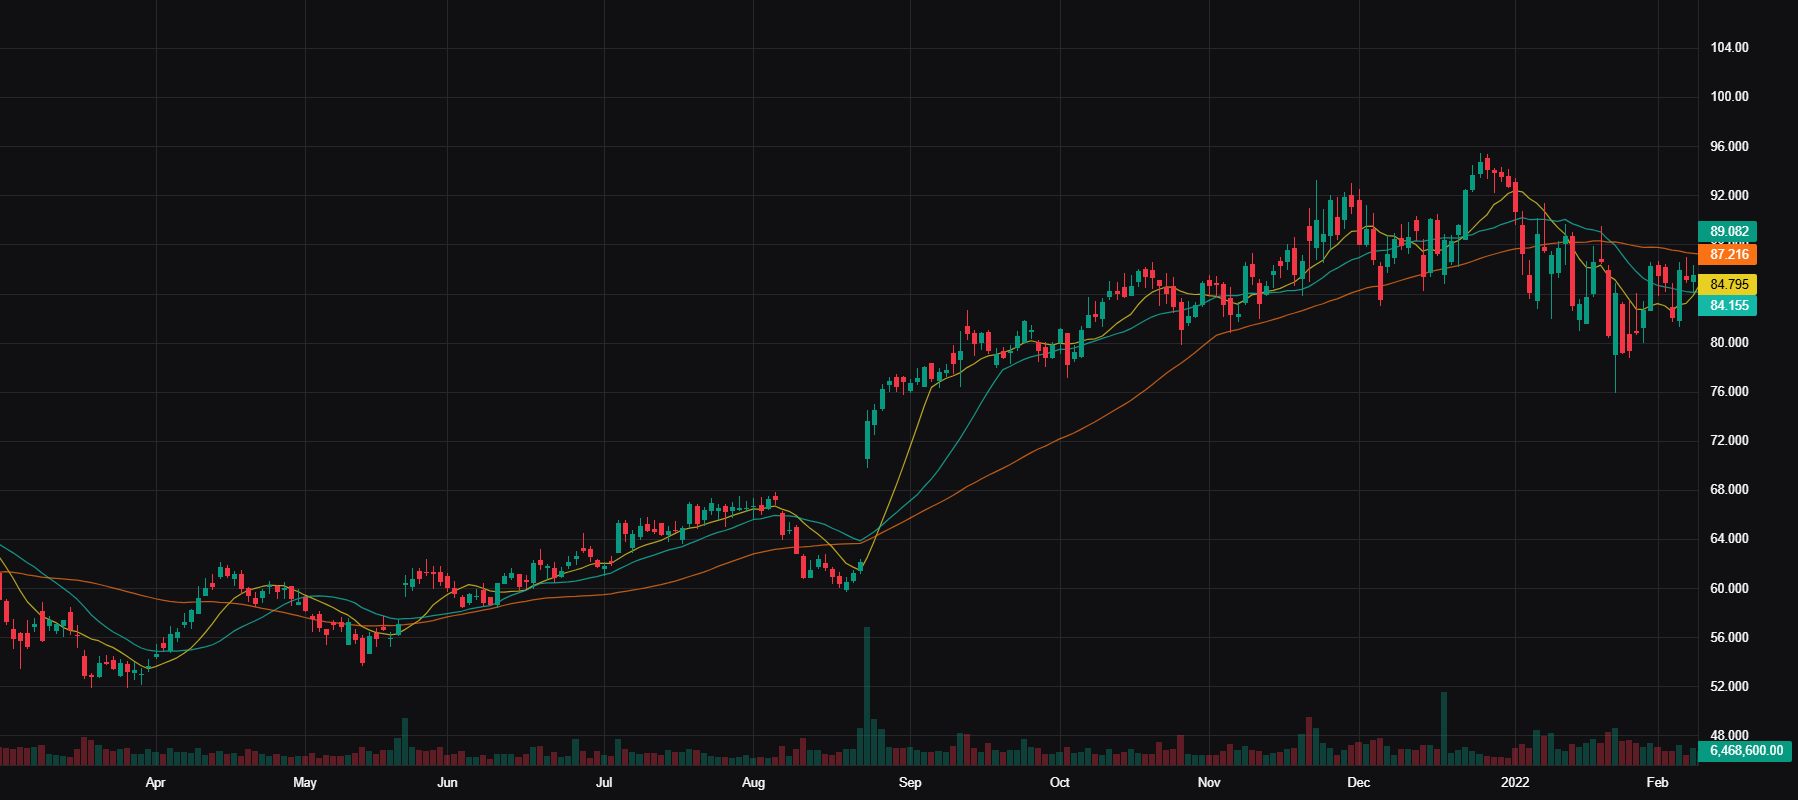
NOW — 2021-08-20 — Flag Breakout — long
Execution: Entry $119.00 | Exit $129.75 | Stop $117.71 | +8.37R | 31 days | 0.1%
Context: Vol 102.5× 20d avg | ADR 2.0% | Mkt Cap $122.72B
Advanced Chart
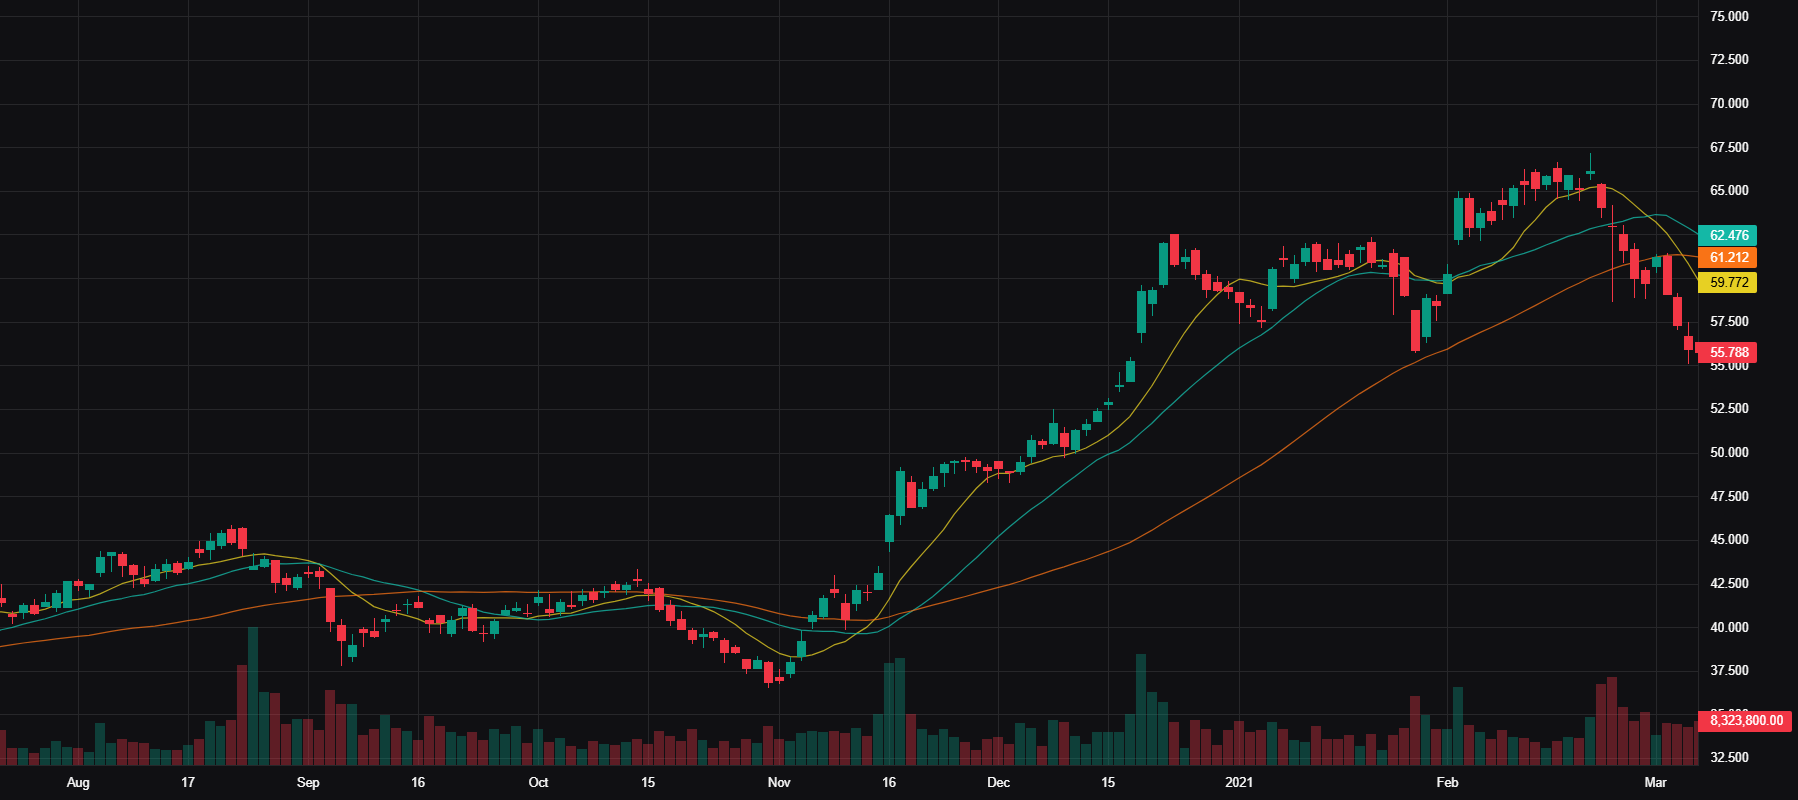
PANW — 2020-11-16 — EP Day Entry — long
Execution: Entry $45.45 | Exit $53.89 | Stop $44.38 | +7.93R | 30 days | 0.2%
Context: Vol 316.6× 20d avg | ADR 3.2% | Mkt Cap $37.04B
Advanced Chart
PLTR — 2025-04-23 — Base Breakout — long
Execution: Entry $100.80 | Exit $123.31 | Stop $97.83 | +7.59R | 30 days | 0.2%
Context: Vol 101.4× 20d avg | ADR 9.6% | Mkt Cap $231.43B
Advanced Chart
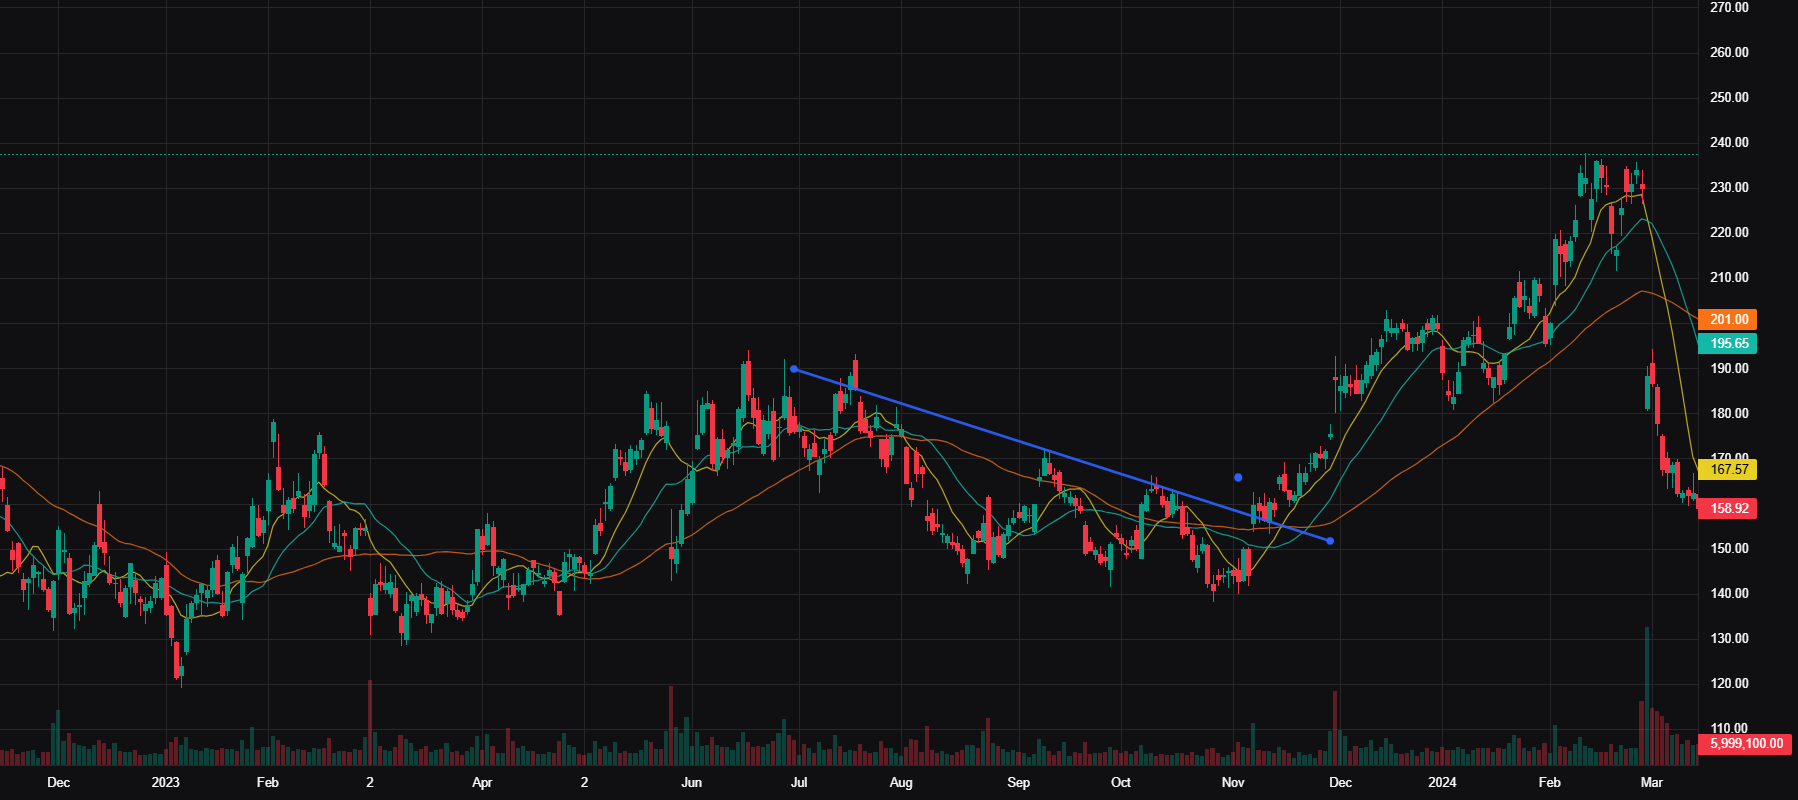
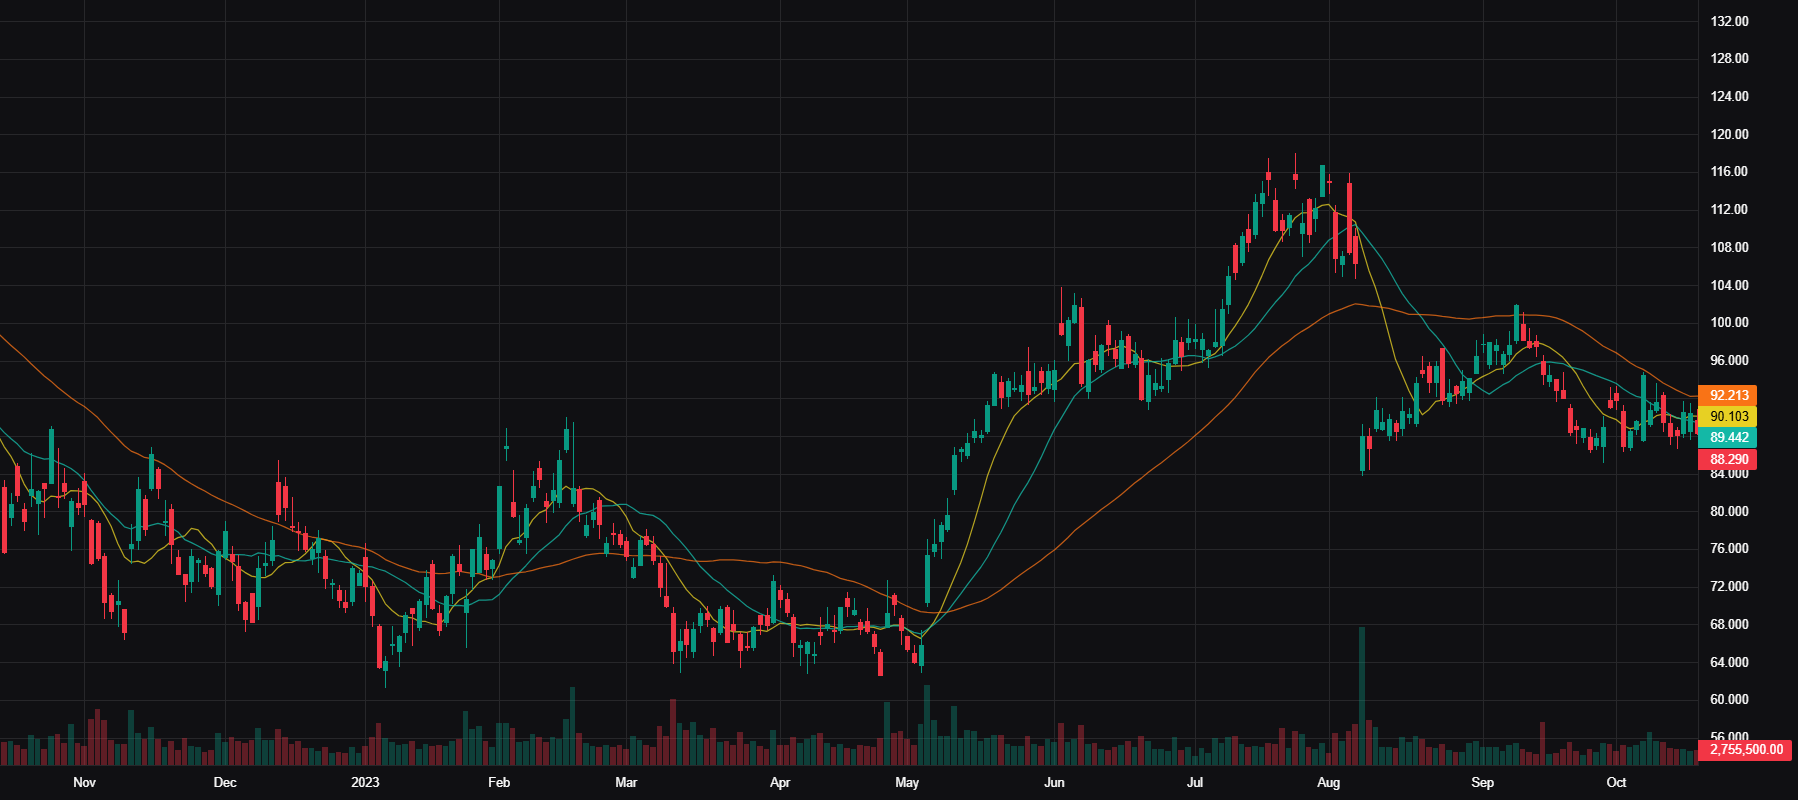
SNOW — 2023-11-06 — — — —
Execution: Entry $158.18 | Exit $187.31 | Stop $153.85 | +6.74R | 30 days | 0.2%
Context: Vol 314.9× 20d avg | ADR 4.1% | Mkt Cap $54.82B
Notes: Breaks a multi-month downtrend, revisits the resistance line and goes on a multi-week run. Was a bit choppy towards the end of the run, 50d would have kept you in.
Advanced Chart
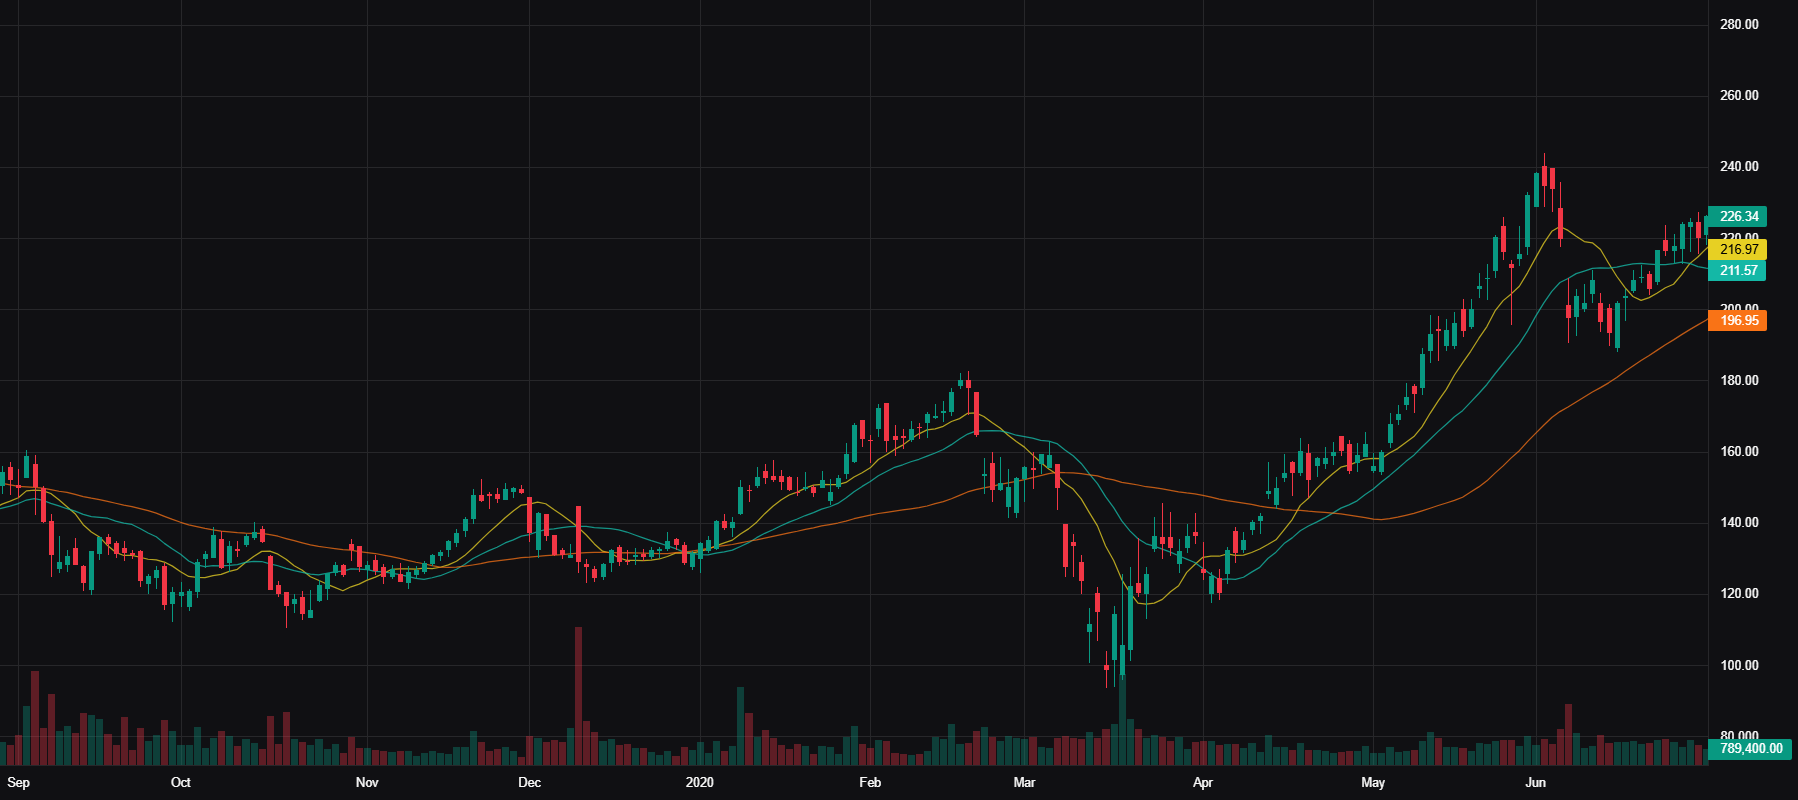
MDB — 2020-05-05 — Flag Breakout — long
Execution: Entry $166.04 | Exit $197.98 | Stop $161.24 | +6.65R | 31 days | 0.2%
Context: Vol 109.2× 20d avg | ADR 5.2% | Mkt Cap $13.35B
Advanced Chart
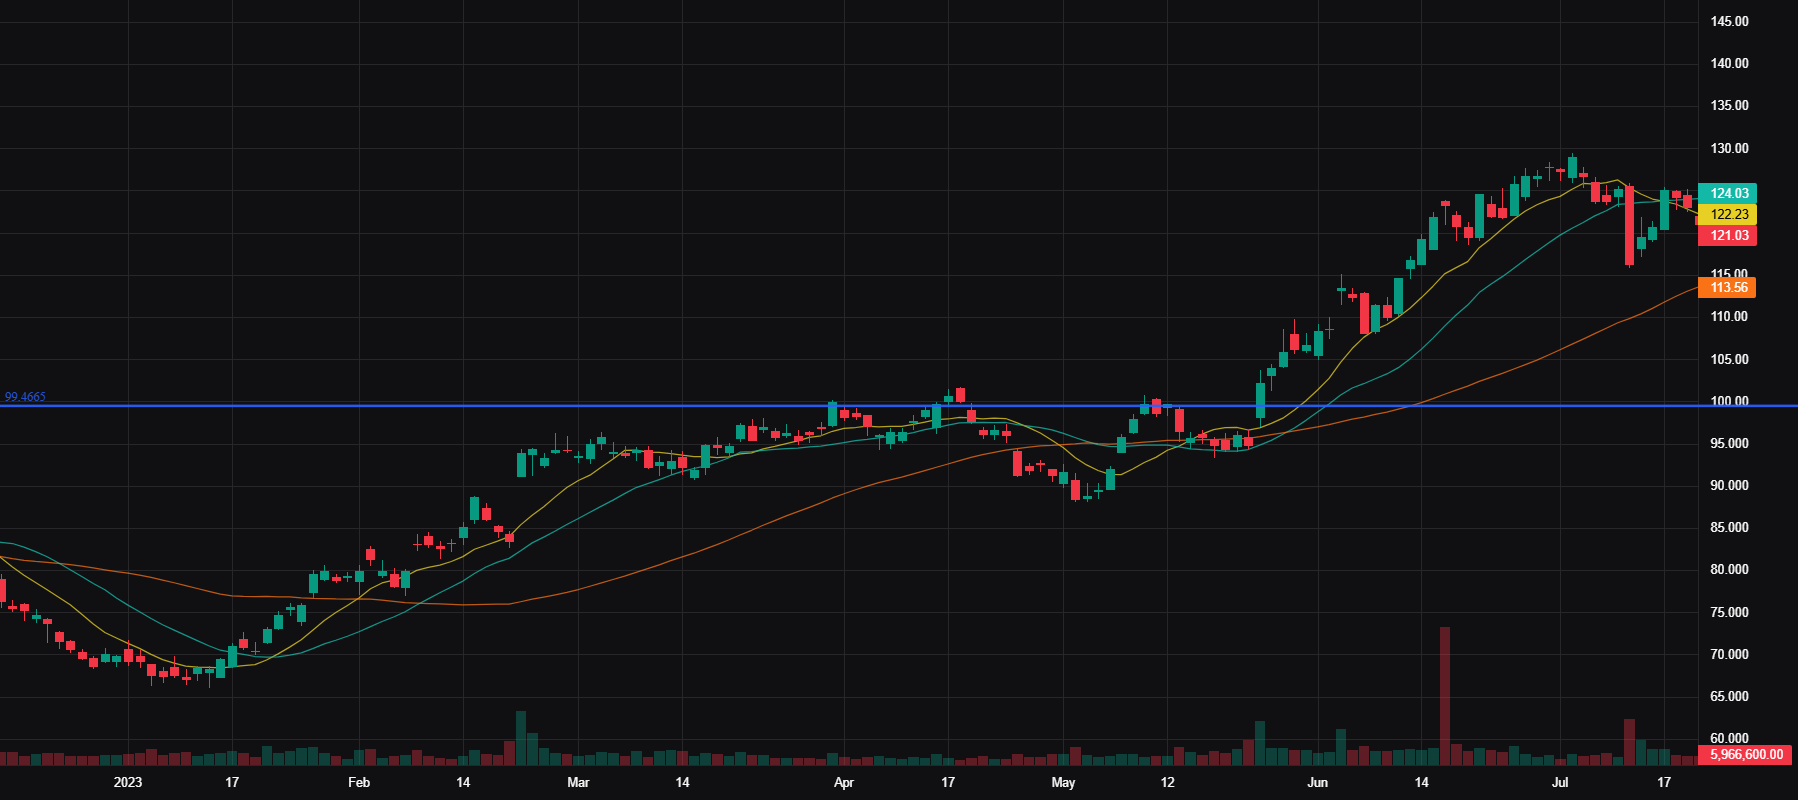
PANW — 2023-05-23 — — — —
Execution: Entry $100.36 | Exit $121.90 | Stop $97.04 | +6.48R | 33 days | 0.2%
Context: Vol 340.2× 20d avg | ADR 2.7% | Mkt Cap $81.80B
Notes: Multi-month sideways action tigthens up and gives a really solid entry. Classic VCP pattern.
Advanced Chart
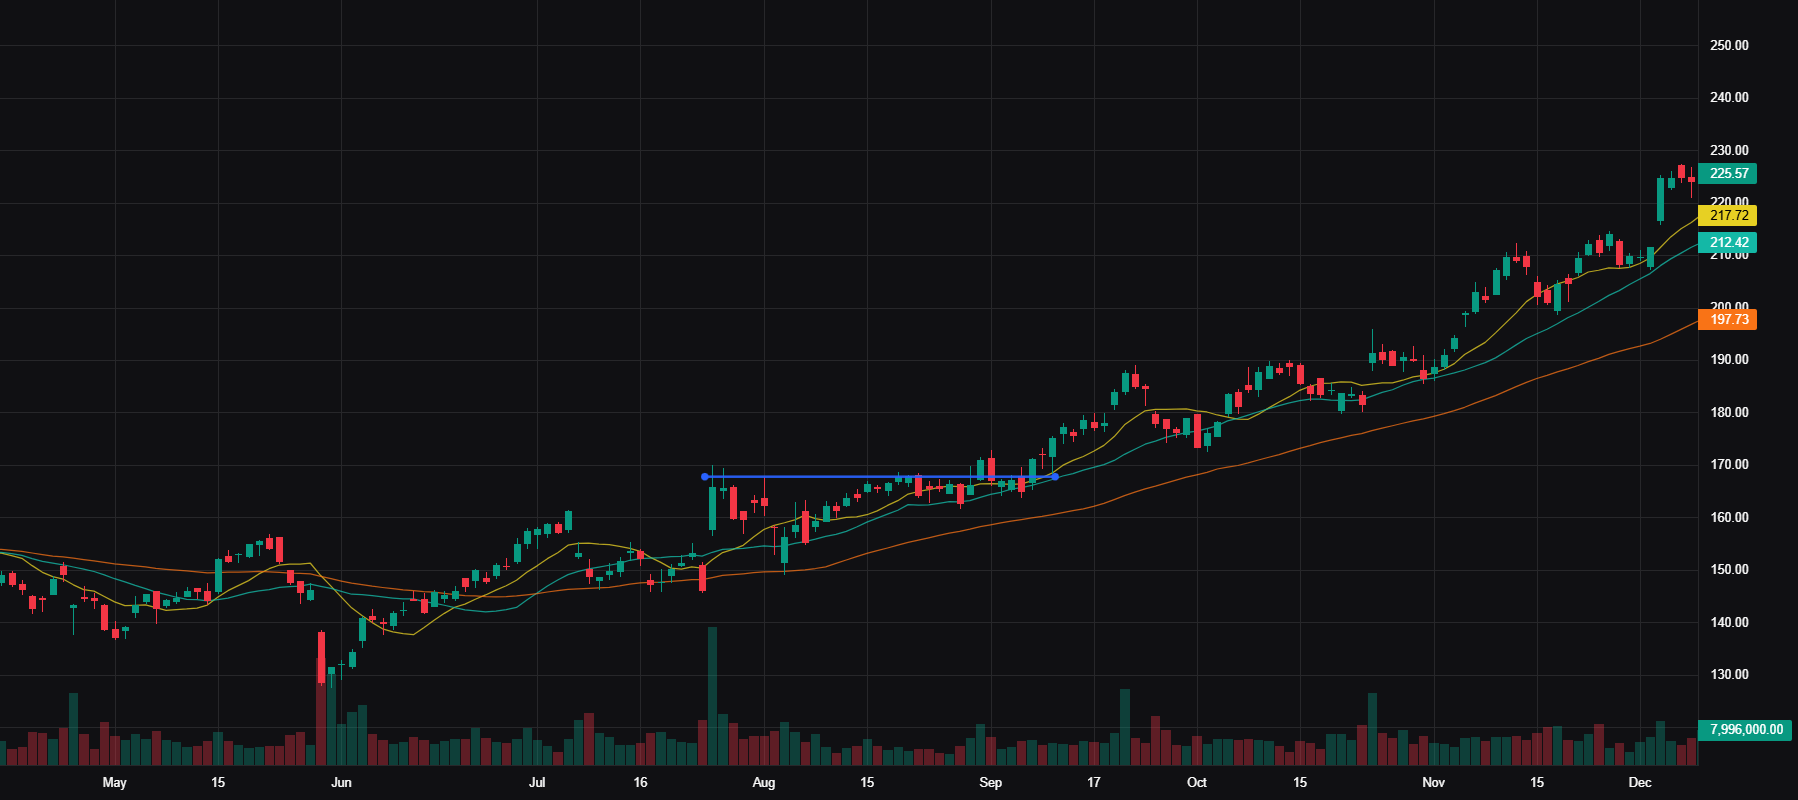
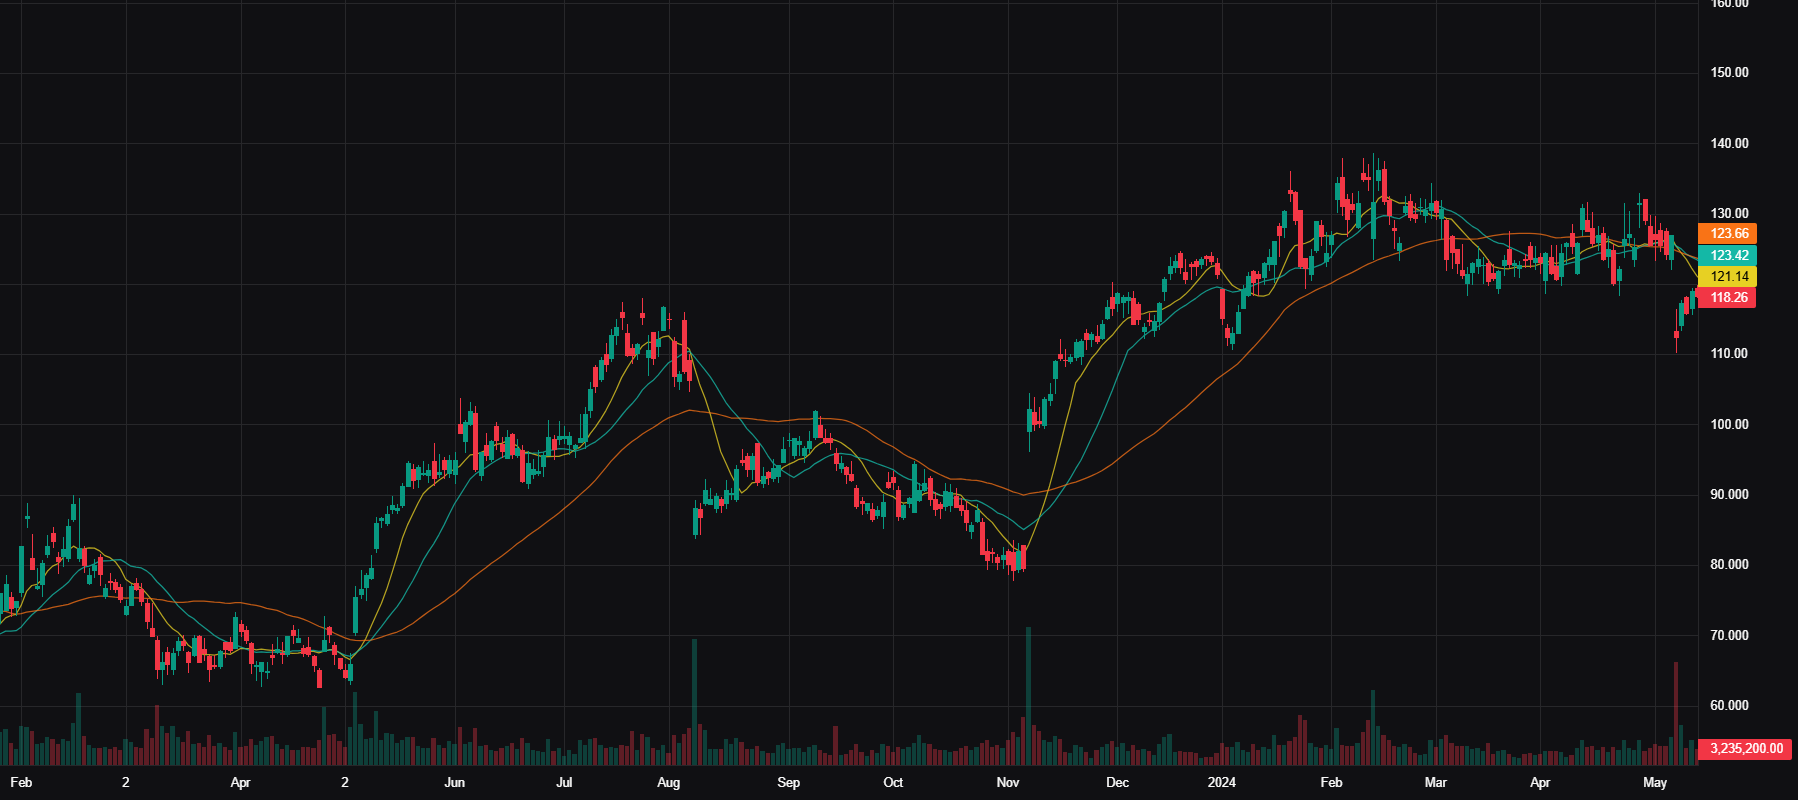
NOW — 2024-09-08 — — — —
Execution: Entry $168.40 | Exit $187.73 | Stop $165.39 | +6.44R | 30 days | 0.1%
Context: Vol 128.4× 20d avg | ADR 2.5% | Mkt Cap $173.67B
Notes: Good earnings in Summer but went sideways after, digesting demand/supply. Sideways range gets broken in the Fall and never looks back.
Advanced Chart
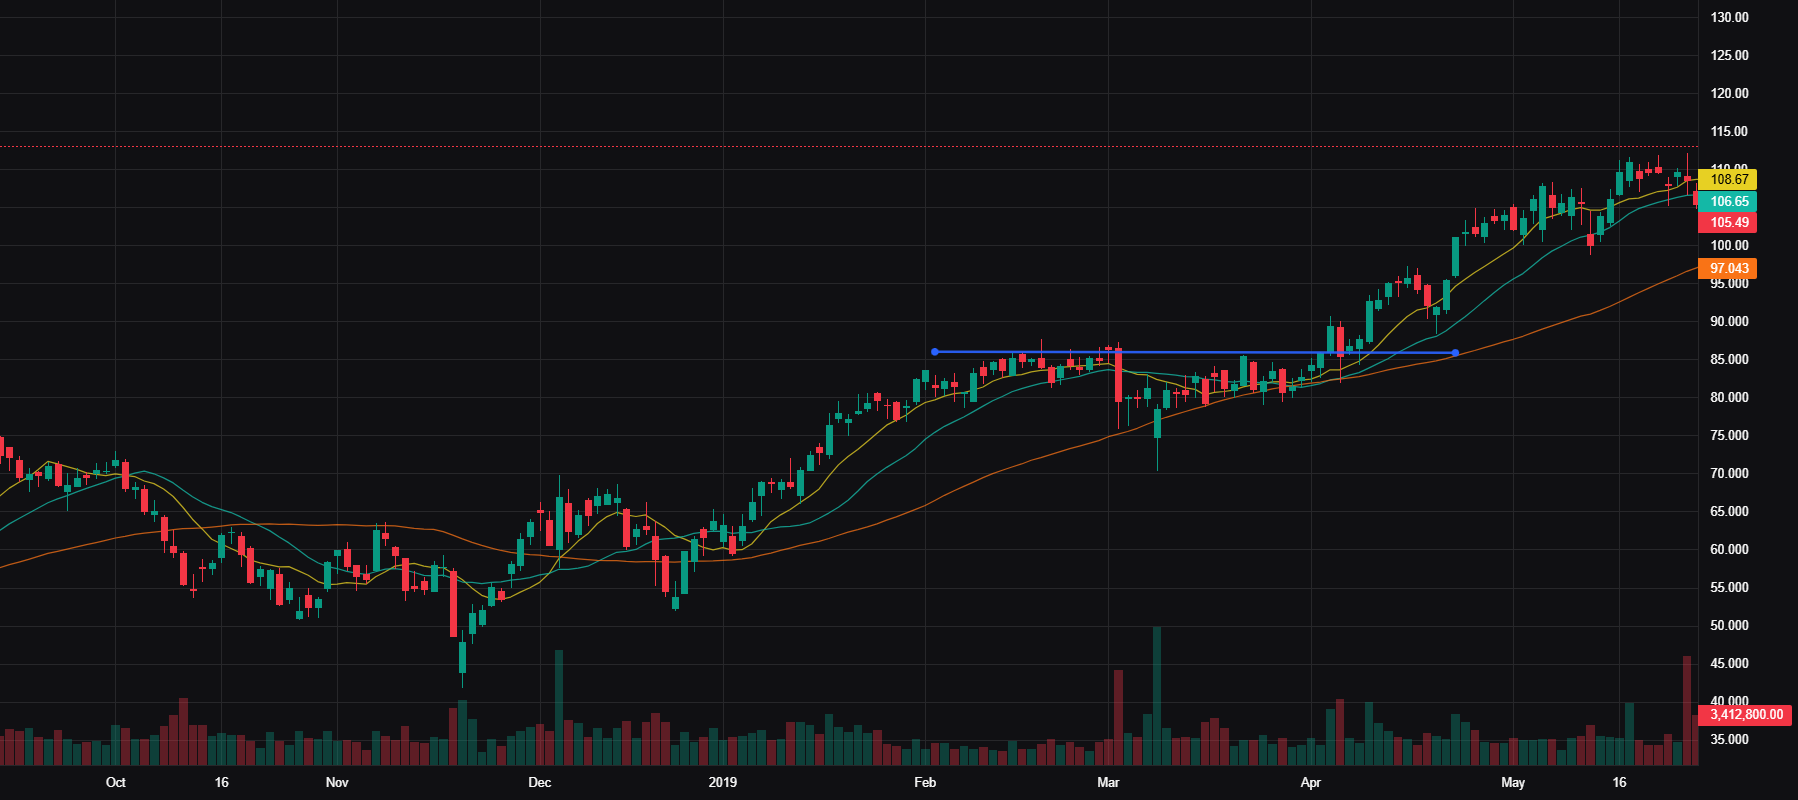
OKTA — 2019-04-09 — Tight Day breakout — long
Execution: Entry $90.33 | Exit $106.39 | Stop $87.16 | +5.07R | 30 days | 0.2%
Context: Vol 198.5× 20d avg | ADR 4.7% | Mkt Cap $15.01B
Advanced Chart
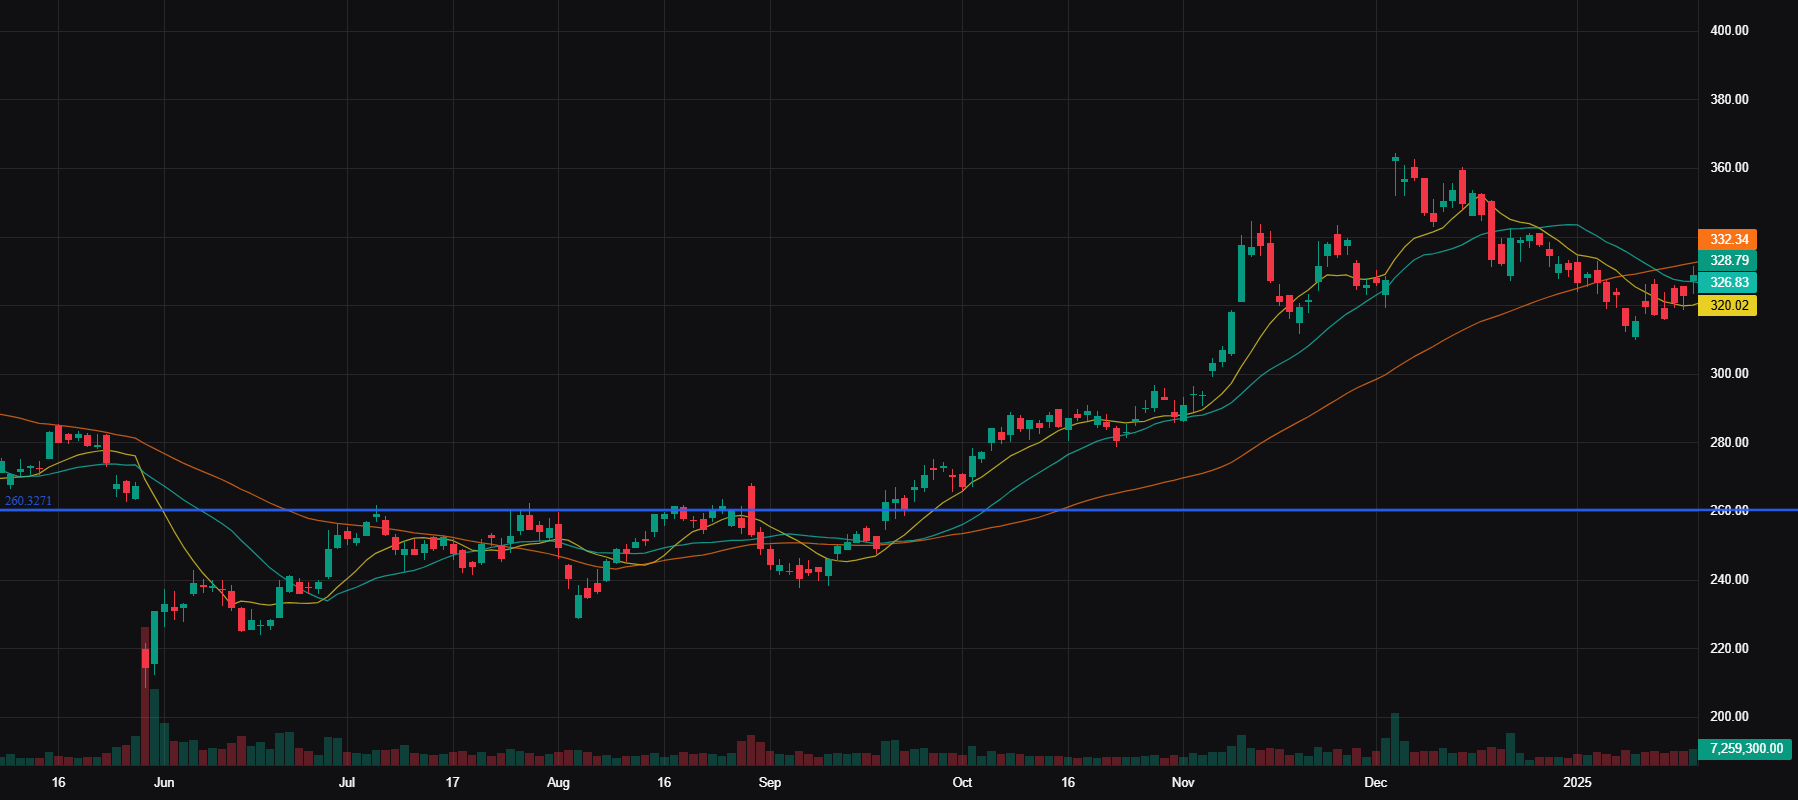
CRM — 2024-09-19 — Base Breakout — long
Execution: Entry $260.46 | Exit $287.61 | Stop $254.79 | +4.79R | 32 days | 0.1%
Context: Vol 175.8× 20d avg | ADR 2.3% | Mkt Cap $213.32B
Advanced Chart
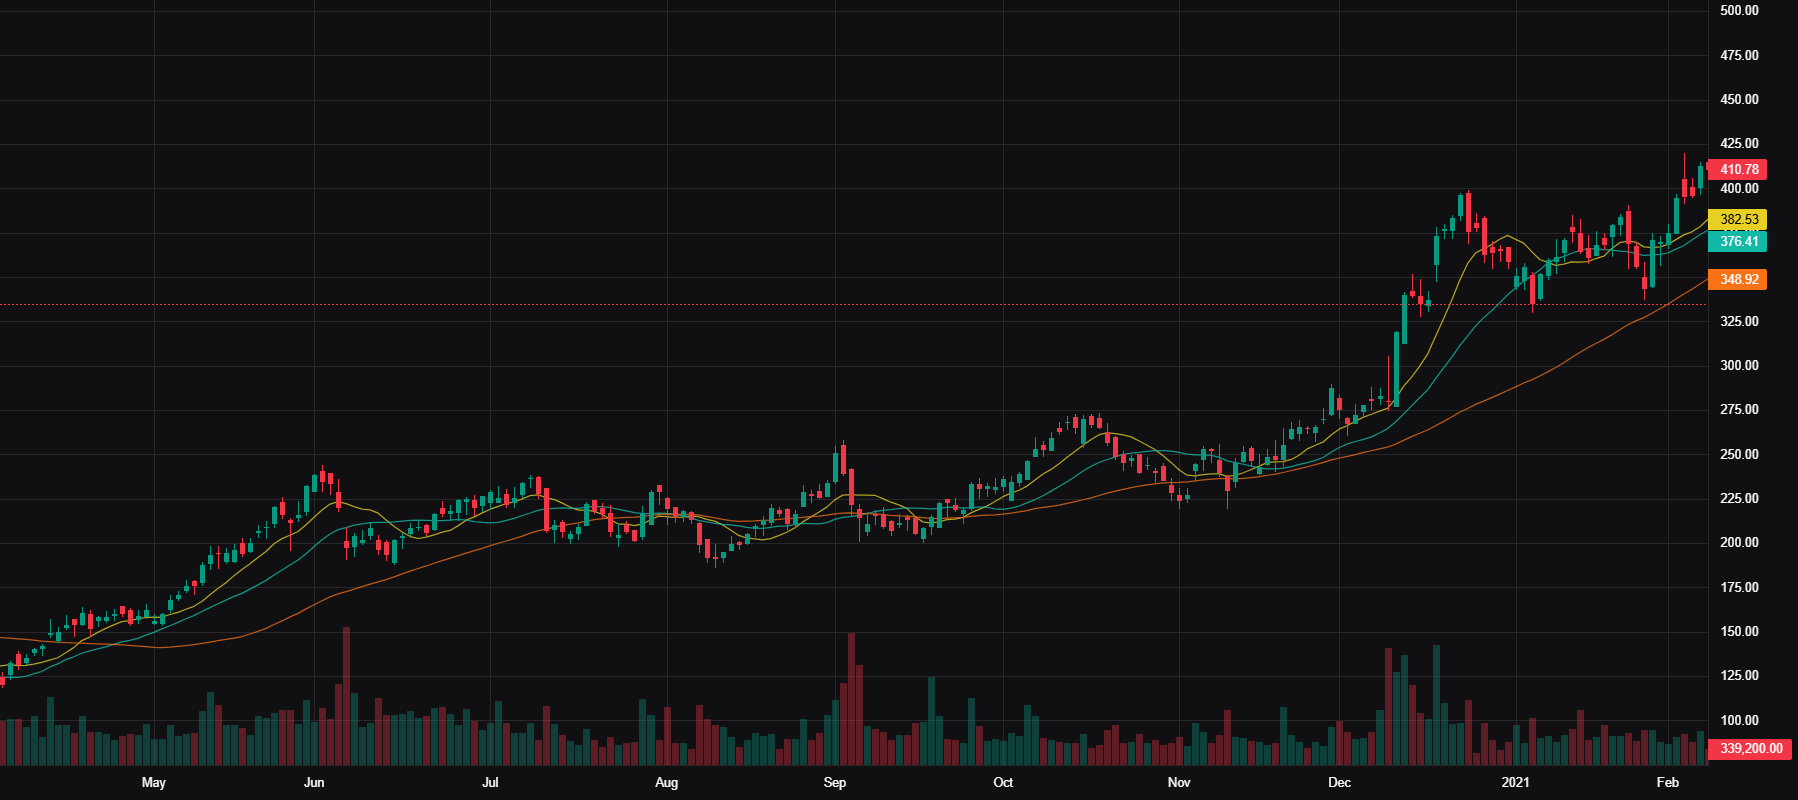
MDB — 2020-12-09 — Flag Breakout — long
Execution: Entry $290.32 | Exit $361.46 | Stop $274.95 | +4.63R | 33 days | 0.2%
Context: Vol 349.6× 20d avg | ADR 4.7% | Mkt Cap $23.35B
Advanced Chart
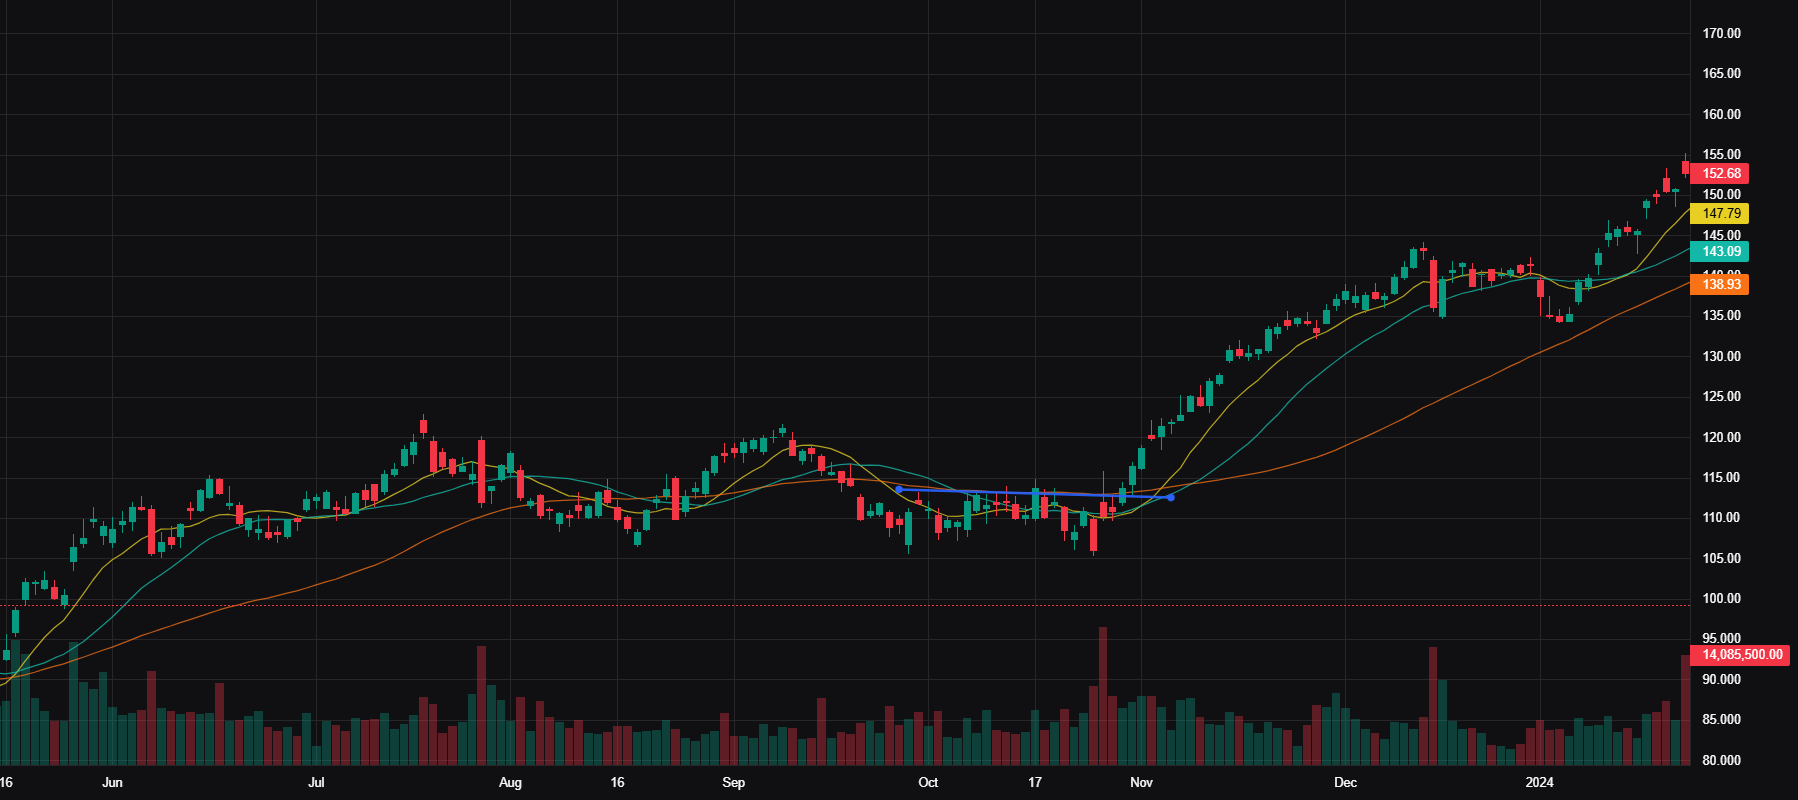
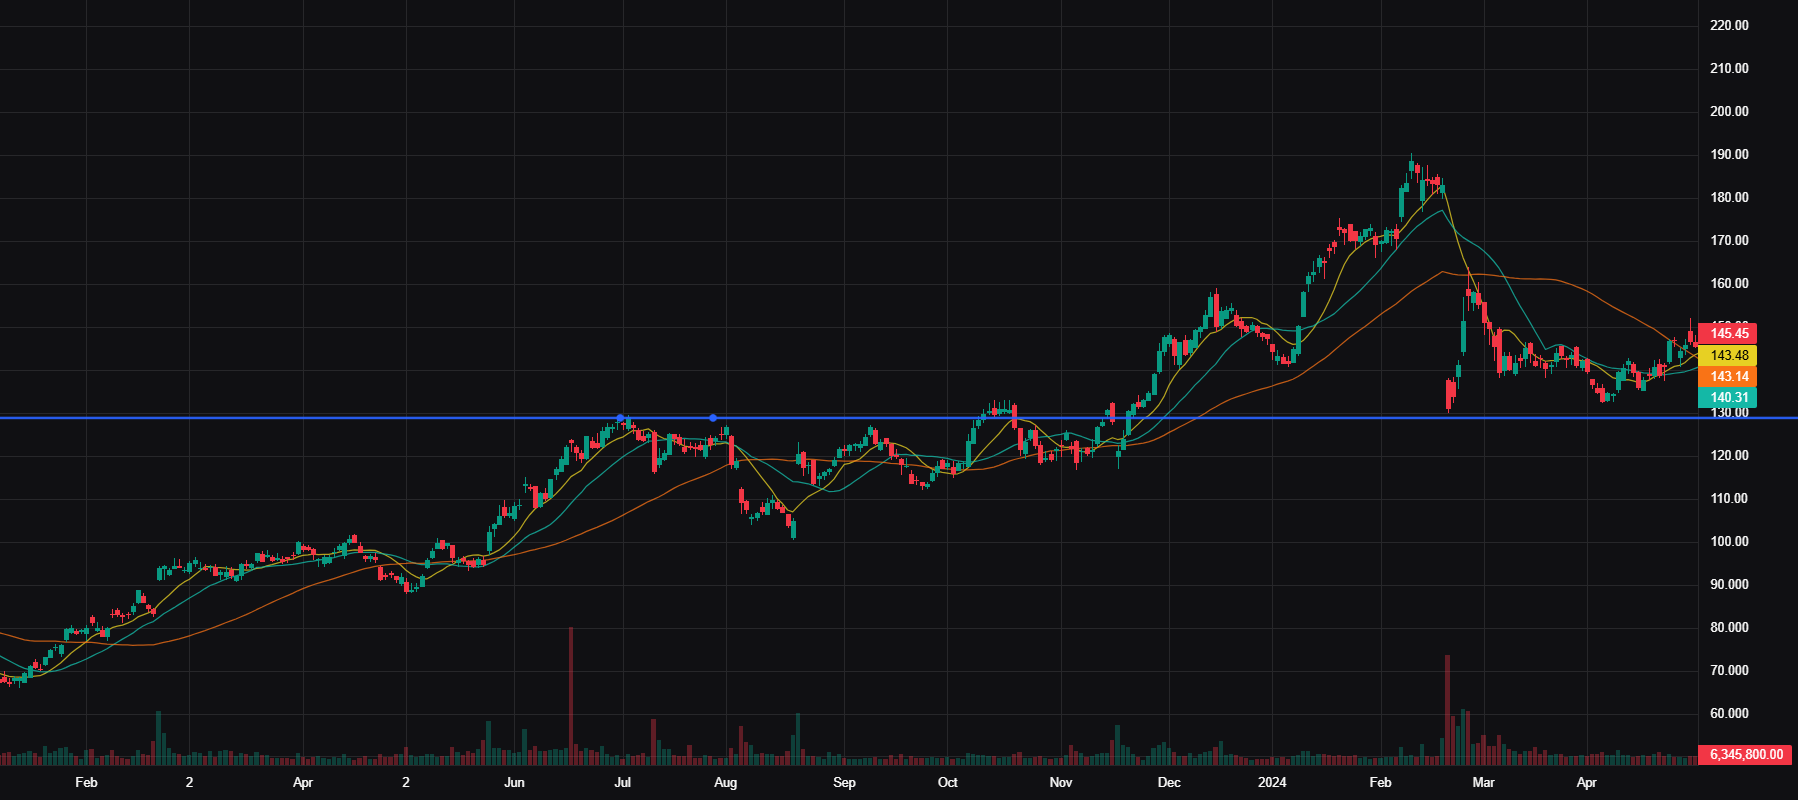
PANW — 2023-11-28 — Base Breakout — long
Execution: Entry $136.84 | Exit $147.79 | Stop $134.32 | +4.36R | 30 days | 0.1%
Context: Vol 124.6× 20d avg | ADR 2.9% | Mkt Cap $111.52B
Advanced Chart
PANW — 2021-08-24 — EP Day Entry — long
Execution: Entry $72.19 | Exit $81.75 | Stop $69.90 | +4.17R | 31 days | 0.1%
Context: Vol 736.5× 20d avg | ADR 2.5% | Mkt Cap $58.84B
Advanced Chart
DDOG — 2025-09-29 — Flag Breakout — long
Execution: Entry $142.49 | Exit $156.00 | Stop $139.10 | +3.99R | 30 days | 0.1%
Context: Vol 109.3× 20d avg | ADR 3.0% | Mkt Cap $47.14B
Advanced Chart
DDOG — 2023-11-07 — EP Day Entry — long
Execution: Entry $100.30 | Exit $115.00 | Stop $96.17 | +3.56R | 30 days | 0.1%
Context: Vol 532.7× 20d avg | ADR 4.6% | Mkt Cap $33.18B
Advanced Chart
DDOG — 2023-07-07 — Range breakout — long
Execution: Entry $99.48 | Exit $106.30 | Stop $97.47 | +3.38R | 31 days | 0.1%
Context: Vol 143.3× 20d avg | ADR 3.8% | Mkt Cap $32.91B
Advanced Chart
CRWD — 2023-10-06 — Base Breakout — long
Execution: Entry $169.97 | Exit $186.78 | Stop $163.00 | +2.41R | 31 days | 0.1%
Context: Vol 229.7× 20d avg | ADR 3.4% | Mkt Cap $43.27B
Advanced Chart
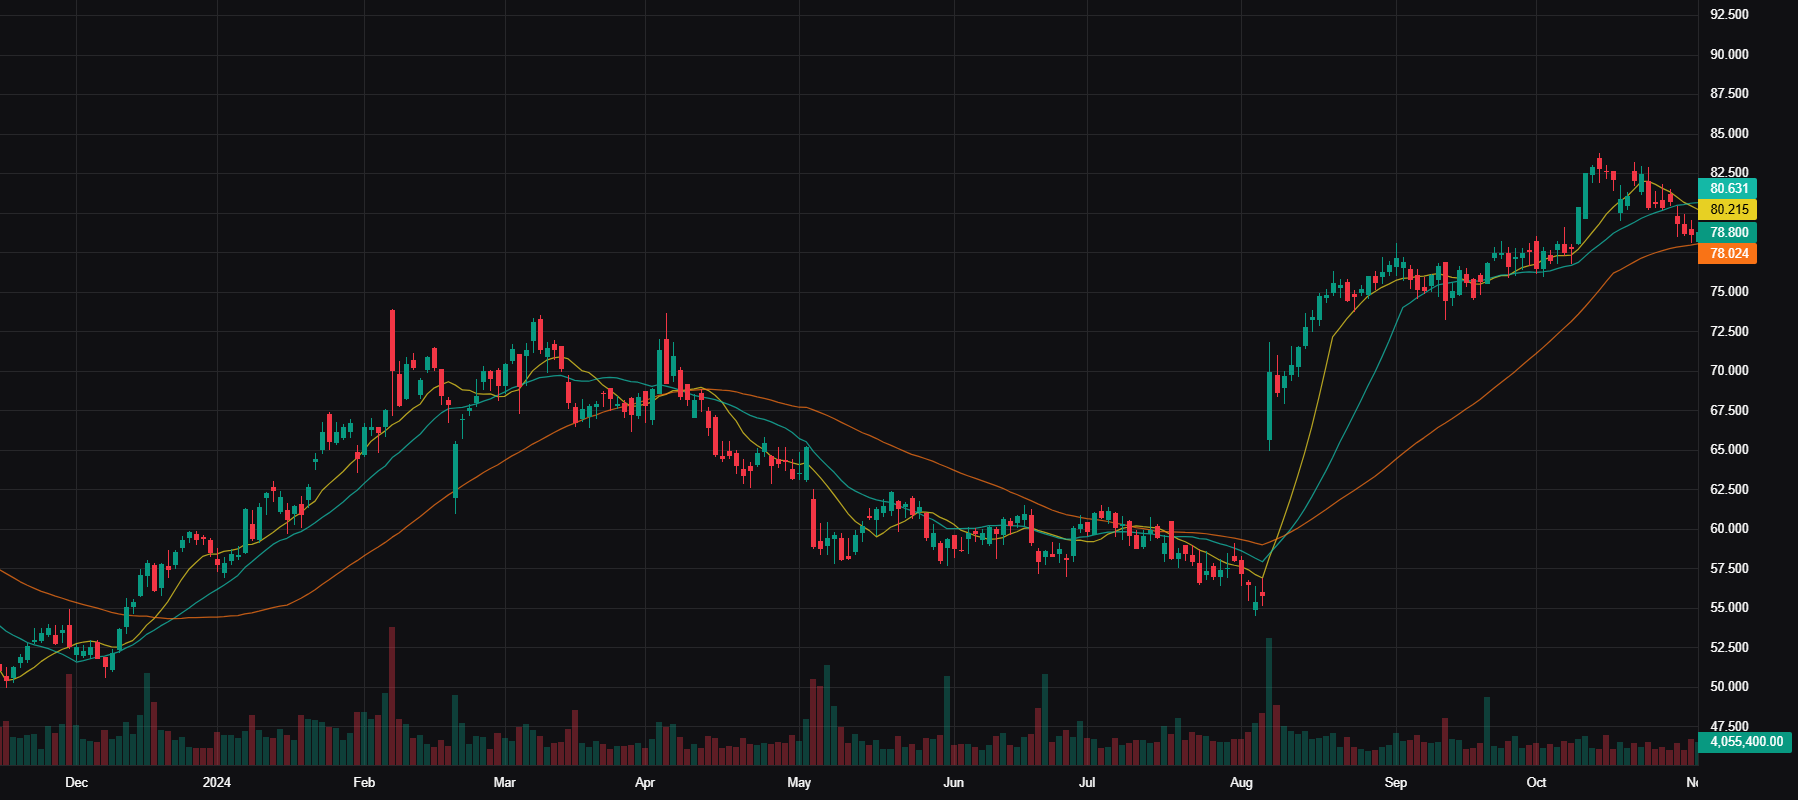
FTNT — 2024-08-06 — — — —
Execution: Entry $68.41 | Exit $75.10 | Stop $65.00 | +1.96R | 33 days | 0.1%
Context: Vol 370.1× 20d avg | ADR 3.2% | Mkt Cap $50.12B
Notes: Fundamental re-rating on Earnings day after stock was left for dead. Went on a multi-week run.
Advanced Chart
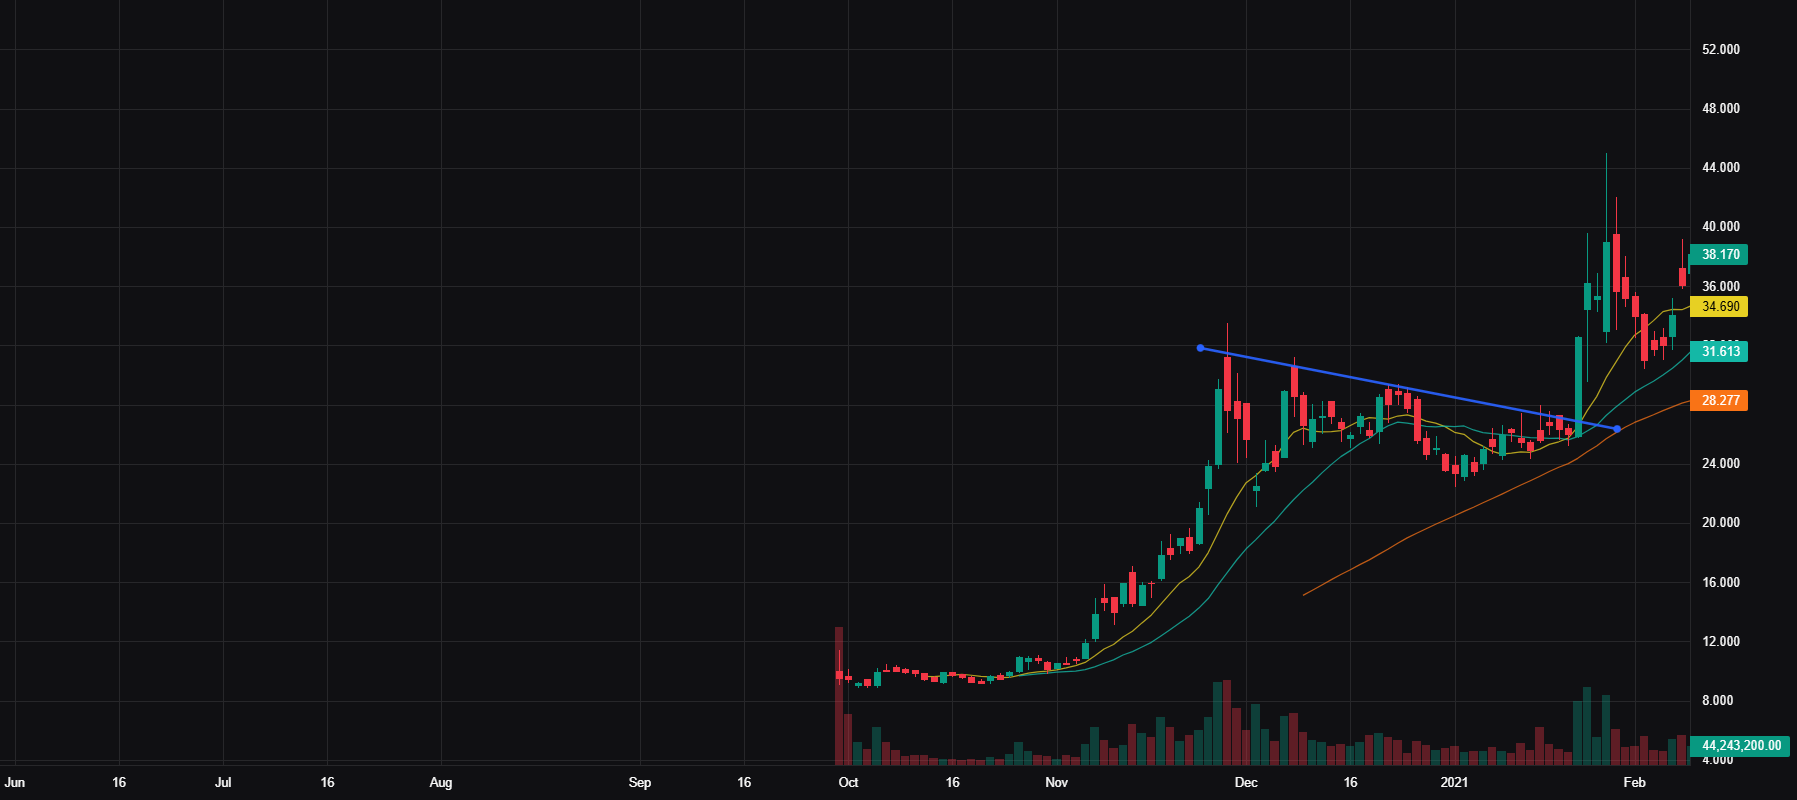
PLTR — 2021-01-21 — — — —
Execution: Entry $29.23 | Exit $28.00 | Stop $25.82 | +0.36R | 31 days | -0.0%
Context: Vol 329.6× 20d avg | ADR 8.3% | Mkt Cap $67.13B
Notes: After the IPO range break and the monster run, stock takes a few month to digest gains building a multi-month flag, then breaks out of a tight spot. Classic KQ action.
Advanced Chart
PLTR — 2023-07-09 — — — —
Execution: Entry $15.64 | Exit $15.41 | Stop $14.95 | +0.33R | 31 days | -0.0%
Context: Vol 89.7× 20d avg | ADR 5.4% | Mkt Cap $35.90B
Notes: Post-IPO range break goes to price discovery. Really good and technical-friendly run.
Advanced Chart
Exit Tactic Optimization
| Exit Rule | N | Win Rate | Avg R | Total R | Capture Eff. |
|---|---|---|---|---|---|
| Actual exit | 33 | 100.0% | +10.20R | +336.75R | 79.1% |
| Trail 5D | 33 | 100.0% | +6.26R | +206.45R | 48.5% |
| Trail 10D | 33 | 100.0% | +8.63R | +284.91R | 66.9% |
| Trail 20D | 31 | 100.0% | +8.00R | +248.08R | 69.7% |
| Trail 50D | 30 | 100.0% | +9.53R | +286.04R | 90.3% |
| Trail 100D | 30 | 100.0% | +12.59R | +377.84R | 119.3% |
| Trail 200D | 30 | 100.0% | +51.45R | +1543.40R | 487.1% |
Key Lessons & Notes
- PANW (2026-05-06): Software had been left for dead due to concerns on AI. Breaks out of a multi-month downtrend on good volume and never looks back.
- FTNT (2026-05-05): Earnings come in better than expected and feared (AI concerns) and stock rerates pretty quickly.
- CRWD (2025-04-22): Not super clean but shook out a lot of people on the second test of 300, once broken above its recent range it continued its uptrend and broke to new highs.
- CRWD (2024-11-05): Beautiful 3-month sideways range with some shakeouts along the way. A bit difficult to find a tight spot for entry but the break of range was a tell-tale sign.
- NOW (2024-09-08): Good earnings in Summer but went sideways after, digesting demand/supply. Sideways range gets broken in the Fall and never looks back.
- FTNT (2024-08-06): Fundamental re-rating on Earnings day after stock was left for dead. Went on a multi-week run.
- PLTR (2024-06-04): Comes out of a multi-month digestion after an EP re-rating. Had some fake breakouts to shake weak hands, but once broken, there were spots to add as well.
- SNOW (2023-11-06): Breaks a multi-month downtrend, revisits the resistance line and goes on a multi-week run. Was a bit choppy towards the end of the run, 50d would have kept you in.
- PLTR (2023-07-09): Post-IPO range break goes to price discovery. Really good and technical-friendly run.
- PANW (2023-05-23): Multi-month sideways action tigthens up and gives a really solid entry. Classic VCP pattern.
- PLTR (2021-01-21): After the IPO range break and the monster run, stock takes a few month to digest gains building a multi-month flag, then breaks out of a tight spot. Classic KQ action.